
目录(5 节)

·
Two Leaderboards: The #1 protocol by TVL earns $12K a day. #2 takes 66% of all fees
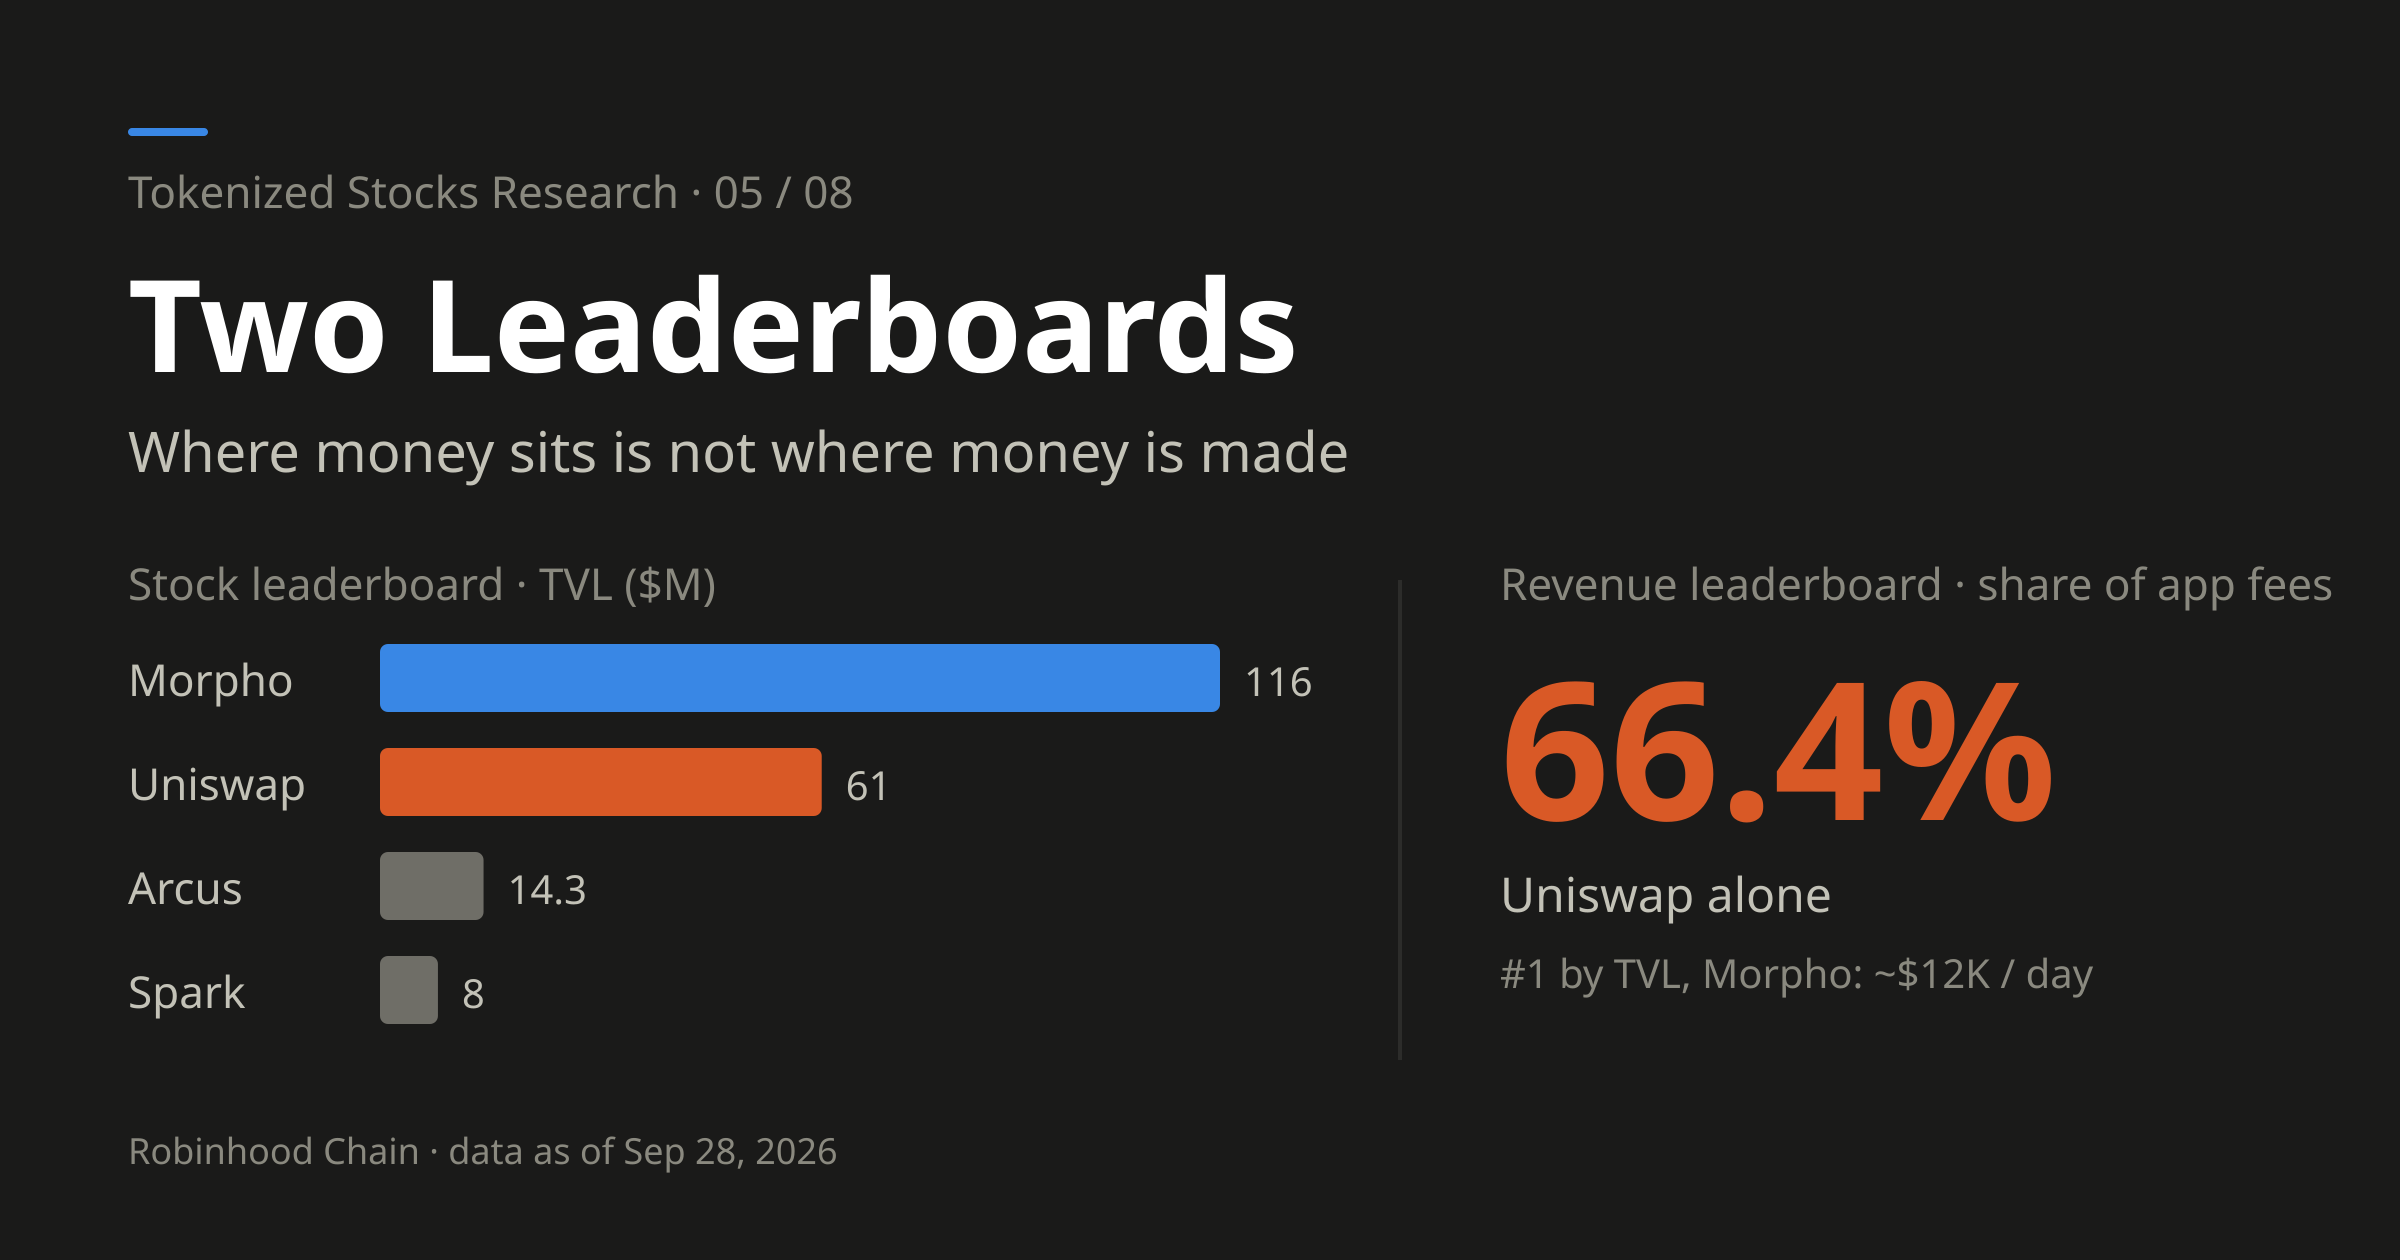
On Robinhood Chain, the #1 protocol by TVL, Morpho, earns about $12K a day. The #2, Uniswap, takes 66.4% of all app fees. For any chain, pull two leaderboards: stock and revenue.
If you use onchain data to make investment or product decisions, this one method will keep you out of a whole class of mistakes.
Robinhood Chain has been live for a little over two months, with 48 apps deployed. Ranked by TVL:
| Protocol | TVL | Fees |
|---|---|---|
| Morpho | $116M (#1) | ~$12K per day |
| Uniswap | $61M | >$26.8M cumulative since launch = 66.4% of all app fees on the chain |
| Arcus | $14.3M | Low |
| Spark | $8M | Low |
| Noxa | $6M | Higher (later faded) |
Where the money sits and where the money is made are not the same place.
Morpho, #1 by TVL, earns about $12K a day in fees.
Uniswap, #2 by TVL, has earned more than $26.8M since launch, two-thirds of all application fees on the chain.
On the same chain, the top protocol by TVL earns a rounding error next to the top protocol by fees.
Two leaderboards
That’s my name for the method: a stock leaderboard and a revenue leaderboard. It fits in one sentence: for any chain, always pull two rankings, by TVL (stock) and by fees (revenue), and see how far apart they are. (At the end I’ll add a third: retention.)
Stock and flow are different units, so it’s no surprise the two lists don’t match. What matters is what the mismatch means. When the two lists overlap, value is easy to locate. When they’re completely out of line, the chain’s revenue comes from high-turnover business, not from where the assets are parked.
Robinhood Chain is the second kind. And the mismatch goes one level deeper:
- 30-day fees across all protocols on the chain: $373.11M
- Of which the sequencer, i.e. the chain itself, took: $39.31M, about 10.5%
Close to 90% of fees are generated at the application layer, not the network layer.
An even more extreme cut: per Token Terminal, of about $21.3B in 30-day DEX volume on the chain, Uniswap did $21.23B.
That’s not “dominant.” That’s 99%.
Why the lists diverge
Three mechanisms, each tied to a specific kind of misjudgment.
-
Stock bought with yield. Robinhood Earn, built on Morpho, pays about 7% APY. USDG deposits grew from $9.5M on July 1 to $456M by late August, at one point 68% of the chain’s TVL. That’s deposits, not turnover. And Earn has announced the rate will be stepped down. The money can leave at any time.
-
High-turnover, low-stock speculation. The chain’s capital turnover (daily DEX volume / TVL) hit 54% in the first week of September. On average, every dollar changed hands every two days. Uniswap earns from turnover, not from stock.
-
Fees accrue at the app layer; the chain only collects congestion rent. In early September, when Pons was launching nearly 25,000 tokens a day, it pushed gas for every transaction on the chain to $0.64. When Pons cooled off, gas fell back to $0.026. Chain-level revenue is a function of congestion, not value.
Using it in practice
In the Robinhood Chain case, the two lists give opposite answers:
- From the TVL list: “Morpho is the most important protocol on this chain”
- From the fee list: “By fees and volume, Uniswap essentially is the application layer of this chain”
Allocate on the first answer and you’ve bought the protocol with the most money parked and a rounding error in earnings.
The fee list also tells you something the TVL list never will: 71.9% of Uniswap’s protocol fees came from this one chain (Sep 3–9, 2026; it was only 50.5% in mid-August). That concentration is an opportunity and a risk at once, and it only shows up on the fee list.
One more: the retention list
Beyond the two lists, look at a third dimension: is the composition of fees changing?
In the same week (Sep 10–16, 2026):
- Pons volume fell 37%; its protocol revenue went from $10.7M to $5.8M (down 46%)
- Uniswap V3 volume doubled from $2.5B to $5.3B (up 112%)
- Uniswap V4 volume fell 22% to $4.9B
- Total DEX volume on the chain rose 5% to $12.8B
The total barely moved. The composition changed dramatically. Look only at the total and you conclude “all fine.” Look only at Pons and you conclude “it’s collapsing.” Both are wrong.
This also explains why chain-level fees fell 97% over the same stretch while transactions fell only 32%: the fee collapse was a collapse in congestion pricing, not in activity.
Three lines to close
Always pull two leaderboards: TVL for stock, fees for revenue. The further apart they are, the more the chain’s story is worth digging into.
TVL is money other people have parked here. Fees are money made here. They answer completely different questions.
When 90% of a chain’s fees are at the app layer and 99% of its volume is in one protocol, “investing in the chain” and “investing in that protocol” are two completely different trades.
When you look at onchain data, do you start with TVL or with fees?
转发此帖子?
与您的关注者分享。
回复