
Where the Yield Comes From: An Investor’s Handbook for Robinhood Chain
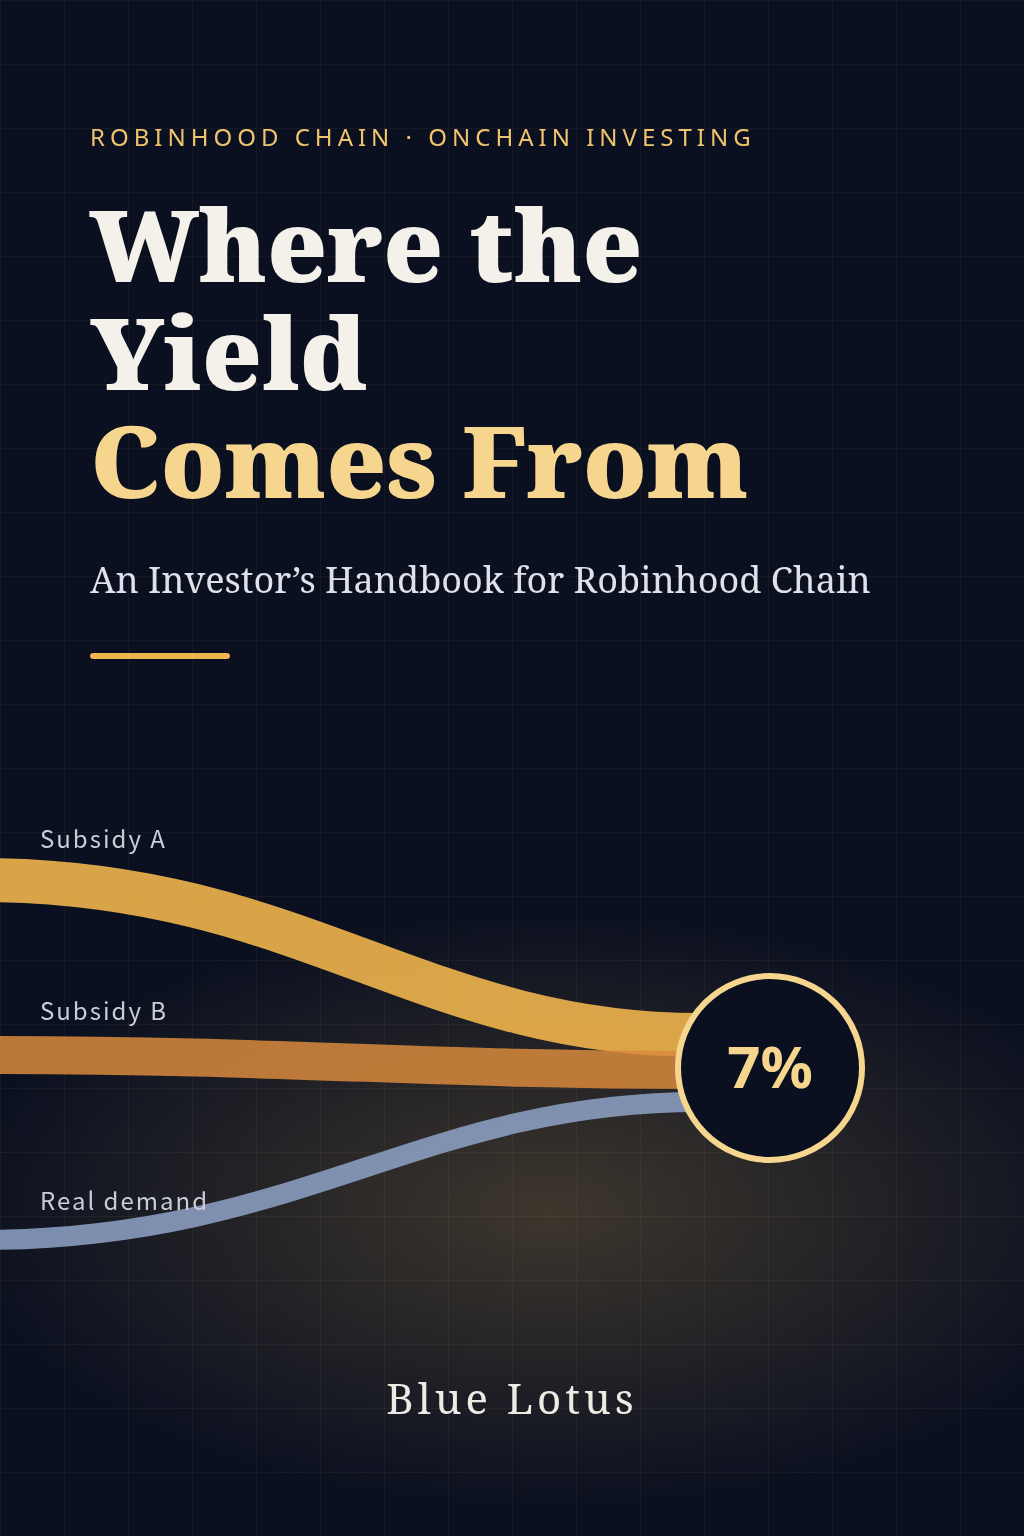
Deposit dollars in Robinhood Earn and you earn about 7% a year. Who pays for it? Using onchain data from Robinhood Chain's first four months, this book finds that about 43% comes from Robinhood's own subsidy, 37% from Ethena's, and only about a fifth from real borrowing demand. It covers stablecoins, lending vaults, stock tokens, LPs, perpetuals and launchpad tokens, with a yield equation, a risk ledger and a ten-minute weekly watchlist. No price calls. Not investment advice.
Intro
Introduction: Before You Put Money Onchain
On November 2, 2026, Robinhood Chain held about $1.045 billion in stablecoins. Roughly $522 million of it sat in a single vault, deposited from about 77,600 addresses. That vault had lent about $458 million to 48 addresses, and the largest of them alone had borrowed about $85.8 million.
Depositors see a yield of about 7% in the Robinhood app. Trace it to the end and about 43% of that yield is paid by Robinhood itself, about 37% by Ethena, and only about one-fifth by genuine borrowing demand.
On the same day, the most active stock trade on the chain was not a stock token. It was an SPY perpetual contract, with about $84.9 million of volume in 24 hours. Longs were paying shorts almost every hour, at an annualized 5–7%. All the stock tokens on the chain, taken together, were worth about $185 million.
These numbers are where this book begins.
What This Book Answers
I have written two earlier books about Robinhood Chain. Robinhood Goes Onchain asked why Robinhood would build a blockchain at all. The Coin Factory asked how the launchpads on this chain make money.
This book asks a third question:
Once an investor puts money on this chain, whose money are they earning, what risks are they carrying, and how much is left after costs?
It starts from the holder’s ledger, not from corporate strategy or project operations. Every conclusion ends in a return you can recompute, a risk you can observe, or a rule you can act on.
Who This Book Is For
- Investors who are allocating, or plan to allocate, capital onchain. You already use wallets, DEXs, and lending markets, and you want to know where each yield on this chain comes from.
- Professionals at brokerages, asset managers, and family offices. You are evaluating whether onchain yield products and stock tokens belong in client portfolios.
- Researchers of onchain finance. You need a method that can be checked against public data, not another project review.
This book does not forecast the price of any asset, recommend buying or selling any asset, or pass judgment on whether any project will survive. The chain has been running for four months. Data from its first phase can tell us about structure, not about outcomes. What we offer are conditions, thresholds, and failure signals at the level of strategy.
The Book’s Argument
In one sentence:
Most onchain yield is paid by someone else. Find out who is paying before you decide whether you want to stand on the other side of them.
There are three layers to that sentence. First, subsidies are everywhere: among the yield pools DefiLlama tracks on this chain, 60% of the TVL-weighted average yield is rewards. Second, even unsubsidized yield has a payer: borrowers, traders, and longs who pay for leverage. Third, standing on the other side means carrying the other side’s risk. Earn depositors are, in effect, funding about twenty highly leveraged wallets.
Seven Frameworks Used Throughout
| Framework | In one line | Chapter |
|---|---|---|
| Round-trip cost | Gas is almost free; the real costs are bridging, slippage, and spreads. Round-trip cost divided by annual yield gives the minimum holding period | Chapter 3 |
| The yield equation | Return = price exposure + trading fees + lending spread + basis and price gaps + subsidies + risk premium. Subsidies have an expiry date | Chapter 4 |
| The two-sided subsidy | Robinhood subsidizes depositors, Ethena subsidizes borrowers, and in between sits a leveraged carry market run by about thirty large wallets | Chapter 5 |
| Calibrate the ruler first | The “persistent premium” on stock tokens is an illusion created by dividend multipliers; the real premium appears on weekends | Chapter 6 |
| Subsidy half-life | In reward-driven pools, the median time for TVL to fall to half its peak is 15 days; the shape of a subsidy decides how long it lasts | Chapter 10 |
| The risk ledger | Record five fields for every risk: trigger, whether it has happened before, worst-case loss, exit time, and whether it can be hedged | Chapter 11 |
| Three-tier portfolios | Income, enhanced, and growth portfolios, configured by region and access, and how each behaves across scenarios | Chapter 13 |
Contents
Part I: Maps and Tools
- Chapter 1: What You Can Hold Onchain: an asset map
- Chapter 2: The Investor’s Dashboard: five places where the data lies
- Chapter 3: Round-Trip Costs and Access: what it costs to move money onchain and back
Part II: Where the Yield Comes From
- Chapter 4: The Yield Equation: every return has a payer
- Chapter 5: The Two-Sided Subsidy: who pays the 7%
- Chapter 6: Calibrate the Ruler First: stock-token premiums and weekend price discovery
- Chapter 7: Market Making and LPs: stock-against-stock pools
- Chapter 8: Leverage, Perpetuals, and Basis: who pays for leverage
- Chapter 9: Position Sizing for High-Volatility Assets
- Chapter 10: The Subsidy Half-Life: incentives, points, and airdrops
Part III: Risk and Information
- Chapter 11: The Risk Ledger: turning every risk into money and time
- Chapter 12: Follow the Money: seventy thousand depositors and forty-eight borrowers
Part IV: Portfolios and Discipline
- Chapter 13: Three-Tier Portfolios: allocating by access, size, and scenario
- Chapter 14: The Investor’s Watchlist: ten minutes a week
Appendices: data worksheets, queries and scripts, contract addresses, tax notes, glossary, and sources
A Note on the Data
- Data are as of November 2, 2026 (UTC), except where marked as October 29.
- Onchain data come from DefiLlama, the Morpho GraphQL API, the Merkl API, GeckoTerminal, the API of Lighter’s Robinhood instance, the Robinhood Chain public RPC, and contract reads via smarts.
- Company data come from Robinhood’s third-quarter 2026 results materials, earnings call, and Form 10-Q.
- Prices of the underlying stocks come from Yahoo Finance.
- All data-collection scripts and raw data are kept in the book’s research directory (Appendix B). Readers can recompute most of the figures in this book.
- Anything that could not be checked against a primary source is marked in the text as “reported by” or “estimated.”
The investment, legal, and tax matters discussed in this book are for research only and do not constitute investment, legal, or tax advice.
— Blue Lotus