
Chapter 2: The Investor's Dashboard: Five Places Where the Data Lies
If you are used to glancing at DefiLlama, DexScreener, or a project’s front end and deciding on the spot, this chapter lists the five easiest places to misread Robinhood Chain and gives you five queries for pulling the data yourself.
One Quarter, Three Numbers
What was DEX volume on Robinhood Chain in its first full quarter, the third quarter of 2026?
- On DefiLlama’s chain-level count, July 1 through September 30 totaled about $90.67 billion.
- Robinhood’s results materials said “more than $80 billion.”
- On the earnings call, the CEO said “more than $100 billion so far,” counting from launch to the day of the call.
Onchain fees tell the same story. DefiLlama recorded about $46.17 million in chain-operator fees for the third quarter. The company spoke of “more than $50 million in onchain fees.” The net revenue attributed to Robinhood Chain in the financial statements was $26 million; the CFO explained that gross revenue was about $50 million and net about $25 million.
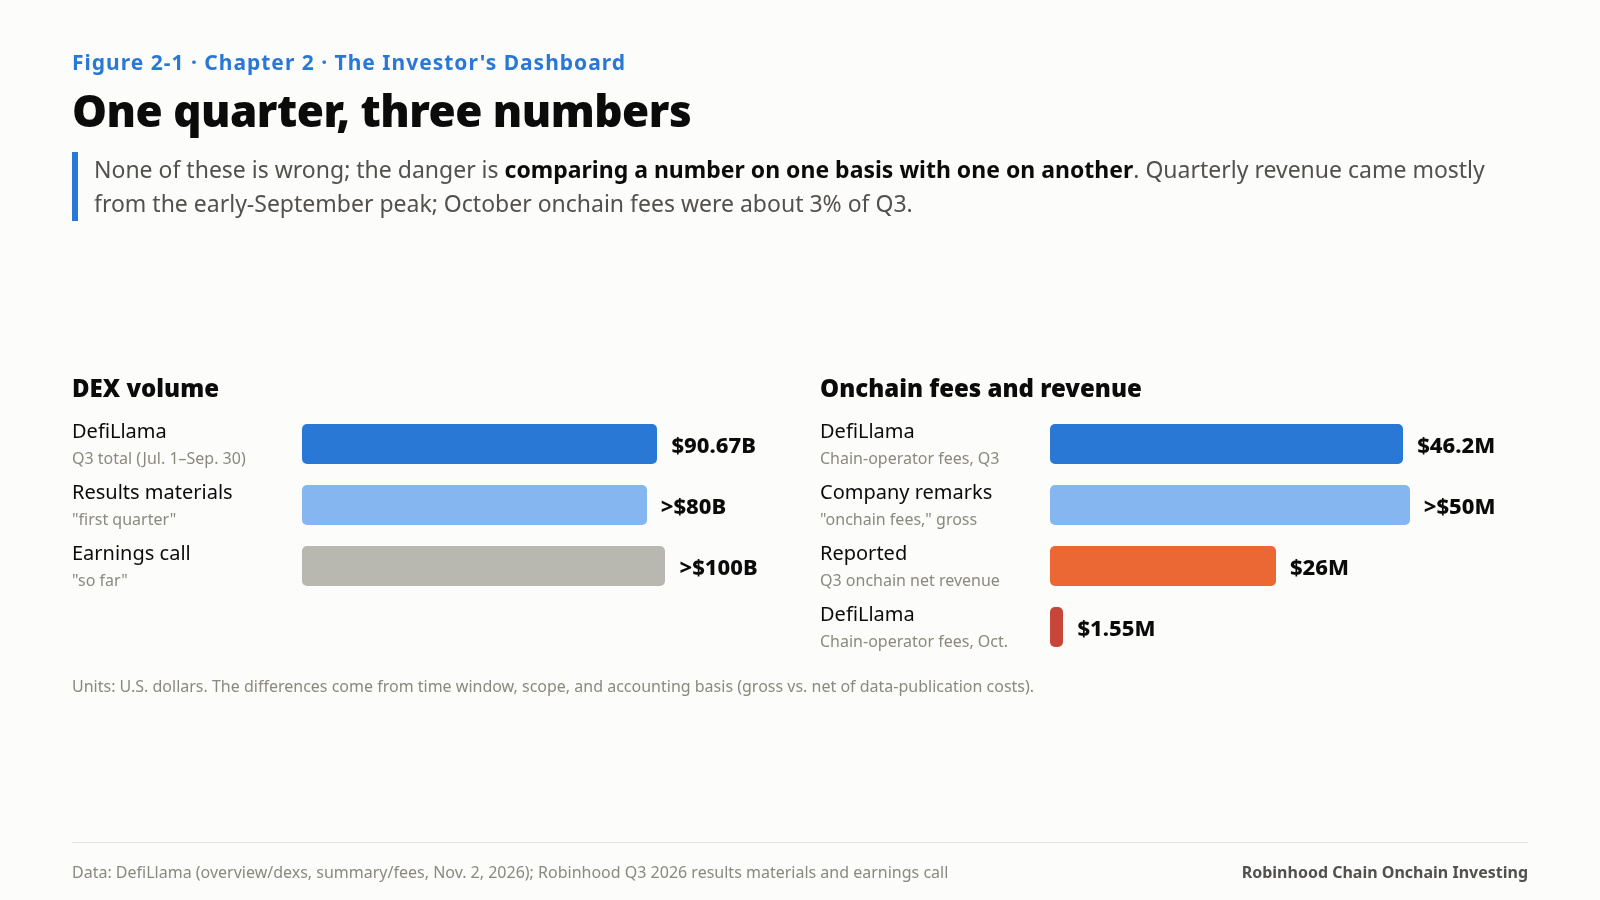
None of these numbers is wrong. They differ in time window (the quarter, or up to the day of the call), scope (all DEXs, or only the identifiable ones), and accounting basis (gross, or net of data-publication costs). What investors need to watch for is comparing a number on one basis with a number on another.
One more pair of numbers is even more telling: chain-operator fees were $46.17 million in the third quarter, but only about $1.55 million for the whole of October. The revenue in the quarterly report came mostly from the trading peak in the first weeks of September.
Here are the five most common ways to misread this chain.
Misreading 1: Double Counting
In DefiLlama’s protocol list, Morpho Blue holds about $608 million on this chain and Steakhouse Financial about $541 million. Together that is more than $1.1 billion, more than the TVL of the entire chain.
The reason is that both numbers describe the same money. Steakhouse curates the vault, and all the USDG it manages sits in Morpho’s lending markets. DefiLlama lists curators as their own category (Risk Curators), so adding up by category counts the money twice.
The same problem arises between stablecoins and lending: the USDe and USDG in Morpho markets are also counted as stablecoins on the chain. That is why Figure 1-1 in Chapter 1 carries the note “categories overlap and should not be added up.”
Rule: when comparing size, use only chain-level TVL or a single protocol’s figure. Do not add categories together.
Misreading 2: The Price Is Not the Onchain Price
DefiLlama provides prices for stock tokens. Pull its quotes for the SPY token from Friday, October 23, 2026, to Monday, October 26, and you will find only 7 distinct prices across 72 hours. The quote sat on a single number all weekend.
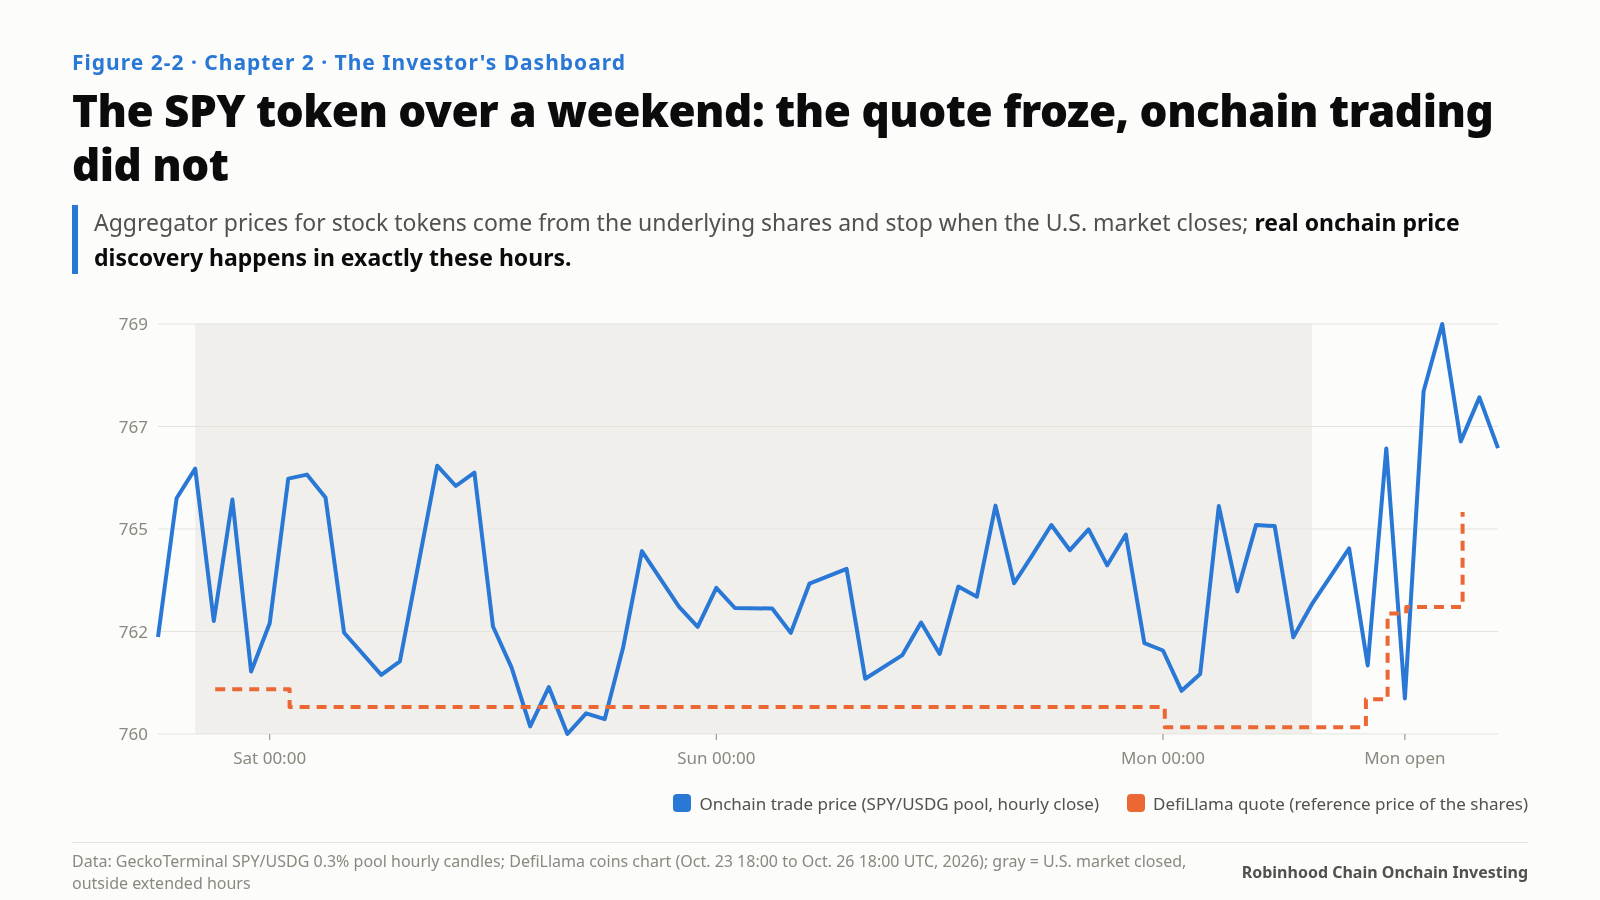
The reason is that this price is a reference price taken from the underlying stock. When the U.S. market is closed, it does not move. Over the same weekend, trades in the onchain SPY/USDG pool kept changing price.
On weekdays the difference barely matters. On weekends it is everything. The “price discovery while markets are closed” that Chapter 6 studies happens exactly during those dozens of hours when the reference price stands still. If you use the reference price to assess weekend risk in stock tokens, you will conclude that nothing moves on weekends. Onchain traders see something else.
Rule: for the onchain price of a stock token, use trade prices from DEX pools or order books, not aggregator quotes.
Misreading 3: One Token Is Not One Share
Compare the onchain price of the SPY token directly with SPY shares and you will find that the token is almost always slightly more expensive: from mid-September on, the median sits steadily around +20 basis points. It is easy to read this as an “onchain premium.”
The real reason is written in the token contract. Robinhood’s stock tokens do not pay cash dividends. Instead, after a dividend they raise a multiplier (uiMultiplier). The SPY token’s multiplier was raised from 1.0 to 1.001718 on September 17, 2026, which means one token now represents 1.001718 shares. Multiply the share price by the multiplier and most of the “premium” disappears.
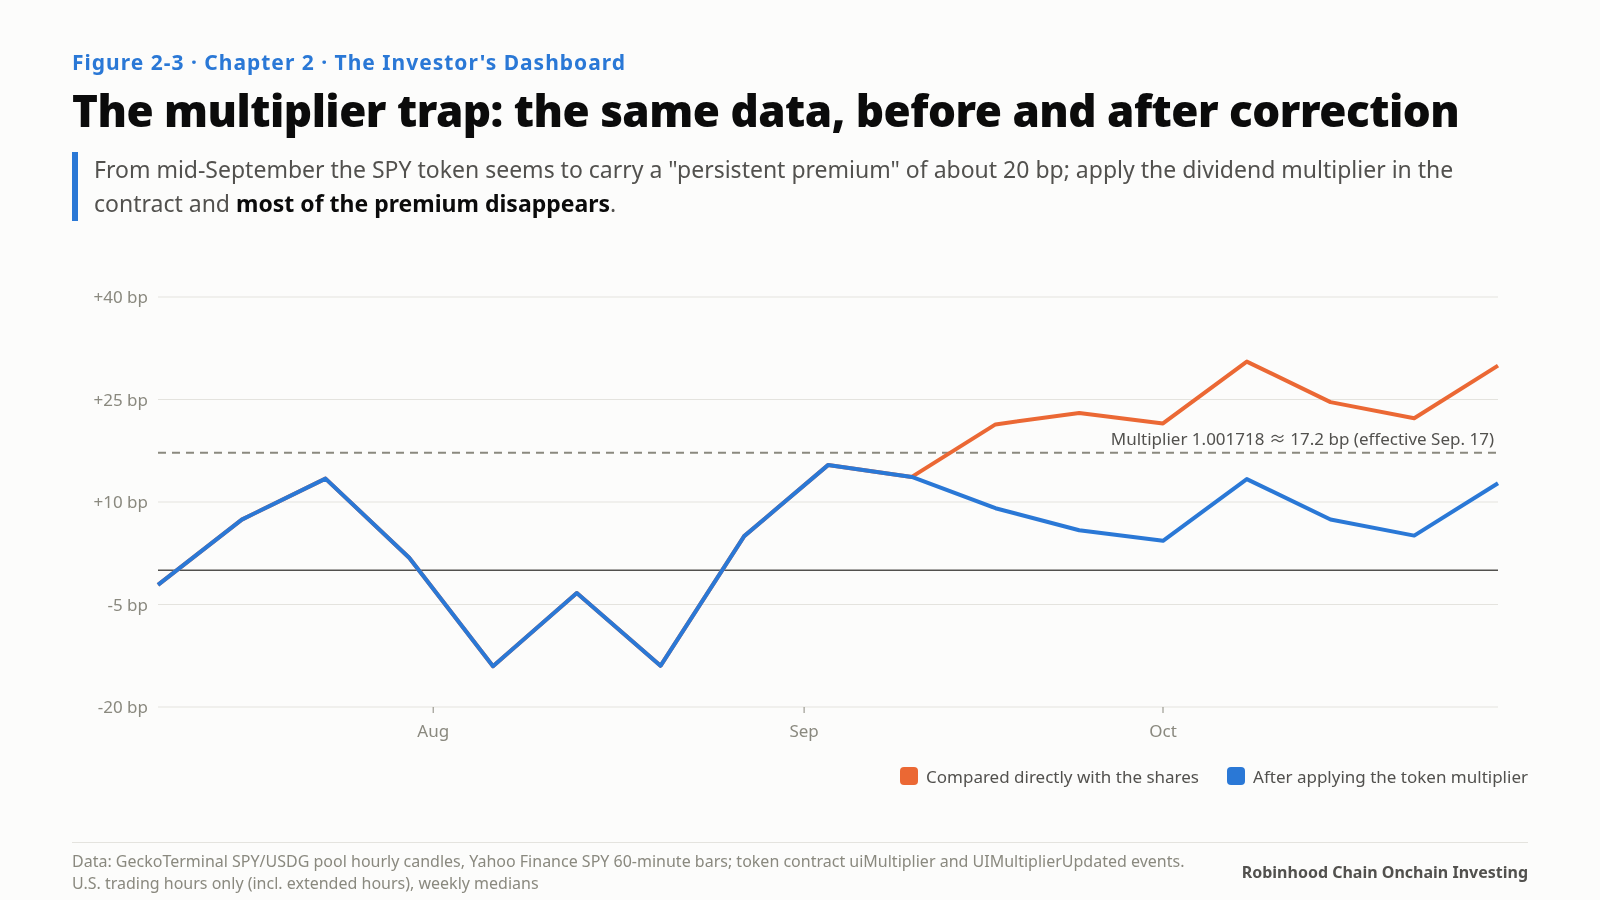
Chapter 6 redoes the entire price-gap analysis with this correction. For now, remember one thing: before you compare, make sure both sides are in the same unit.
Misreading 4: Half the APY Belongs to Someone Else
DefiLlama shows a yield of about 7% for the Steakhouse USDG vault. Broken down, the base interest is about 4.06% and the rewards about 3.10%. The rewards come from an incentive campaign on Merkl called “[Robinhood Users Only],” and they are paid only to users who deposit through Robinhood. If you deposit into the same vault directly from another wallet, you get only the base interest.
The opposite misreading exists too. DefiLlama shows a 0% yield for the syrupUSDG and mGLO markets on Morpho. That is because it measures the collateral side, and collateral earns no interest inside Morpho. But these two collateral assets are appreciating on their own. The borrowers’ return is hidden in the collateral price, not in this table.
Rule: for any APY, ask three things. Which part is rewards? Who gets the rewards? When do the rewards stop?
Misreading 5: A Quote Is Not a Fill
Bridges and aggregators give attractive quotes. Testing Relay’s public quote API: converting $100,000 of USDC on Base into USDG on this chain cost about 6 basis points and arrived in one second. But the same API flatly refused to quote $1 million, citing a “maximum fill amount of $500,000.” It also refused to quote stock tokens.
Stock-token liquidity onchain is thinner still. In the main stock-token pools tracked by GeckoTerminal, the median of the last 300 trades was only $100 to $700, and the largest was about $12,000. The TVL a pool displays is one thing. How far your next $100,000 order will push the price is another (Chapter 3).
Rule: to judge whether you can get in and out, use real order-book depth and trade records, not a pool’s TVL.
Five Queries for Pulling the Data Yourself
Most of the numbers in this book can be recomputed from public APIs. The five below cover what investors need most often. (The full scripts are in Appendix B.)
1. Chain and protocol data: DefiLlama
https://api.llama.fi/v2/historicalChainTvl/Robinhood%20Chain
https://yields.llama.fi/pools            (filter chain = "Robinhood Chain"; check apyBase and apyReward)
https://yields.llama.fi/chart/{pool}     (daily TVL and yield history for one pool)
2. The real structure of a lending market: Morpho GraphQL
POST https://blue-api.morpho.org/graphql
{ marketPositions(first: 100, orderBy: BorrowShares, orderDirection: Desc,
    where: { marketUniqueKey_in: ["<market ID>"], chainId_in: [4663] })
  { items { user { address } state { borrowAssetsUsd collateralUsd } } } }
It tells you who is borrowing, how much, and how far each position is from liquidation. The concentration data in Chapters 5 and 12 come from here.
3. Where subsidies come from and when they end: Merkl
https://api.merkl.xyz/v4/opportunities?chainId=4663&items=100
https://api.merkl.xyz/v4/opportunities/{id}/campaigns
The funding address, reward token, budget, and start and end dates of every incentive are public.
4. Onchain prices for stock tokens: GeckoTerminal hourly candles
https://api.geckoterminal.com/api/v2/networks/robinhood/pools/{pool address}/ohlcv/hour?limit=1000
Use Yahoo Finance’s 60-minute bars (including pre-market and after-hours) as the reference price, then multiply by the token’s multiplier.
5. The real state of a contract: RPC and smarts
eth_call  ->  uiMultiplier()           (stock-token multiplier)
eth_getLogs -> UIMultiplierUpdated     (history of multiplier changes)
smarts get_admin_risk                  (whether the contract is upgradeable, mintable, pausable)
Robinhood Chain’s public RPC does not keep all historical state, and a single eth_getLogs call cannot span more than 10 million blocks. The API of the Blockscout block explorer sits behind Cloudflare protection and blocks scripted access, so look things up in a browser.
If You Are Building Your Own Dashboard
- Fix the basis before reading the number. Next to every number, write its time window, scope, and source. It is the cheapest way to tell research from rumor.
- Check three kinds of data every week: size (chain TVL, stablecoins), price (DEX trade prices, not reference prices), and subsidies (budgets and end dates of Merkl campaigns). A subsidy’s end date deserves a place on your calendar more than the yield itself.
- When you see an “anomaly,” suspect the ruler first. For several of the “startling findings” in this book, the first step was to check units, basis, and data source, and half of them vanished at that step.
Data does not lie on its own; we pick up the wrong ruler. Calibrate the ruler first, then read the marks.
Sources for This Chapter
- DefiLlama: overview/dexs and summary/fees/robinhood-chain (quarterly and October totals, November 2, 2026); protocols API (Morpho Blue and Steakhouse Financial TVL, October 29, 2026); coins chart (hourly SPY token quotes, October 23–26, 2026)
- Robinhood Q3 2026 earnings press release, results presentation (onchain net revenue of $26 million), and earnings call (gross revenue of about $50 million, net about $25 million)
-
uiMultiplier()andUIMultiplierUpdatedevents on token contract0x117c…4c0c(Robinhood Chain RPC) - Merkl v4 API: the “[Robinhood Users Only] Supply to Steakhouse USDG V2 vault” campaign
- Relay quote API
api.relay.link/quote(November 2, 2026) - GeckoTerminal: the last 300 trades in each pool (November 2, 2026)