
目录(5 节)

·
A Chain Famous for Stocks Holds $1 Billion Earning Interest: Five Traps in Reading Its Data
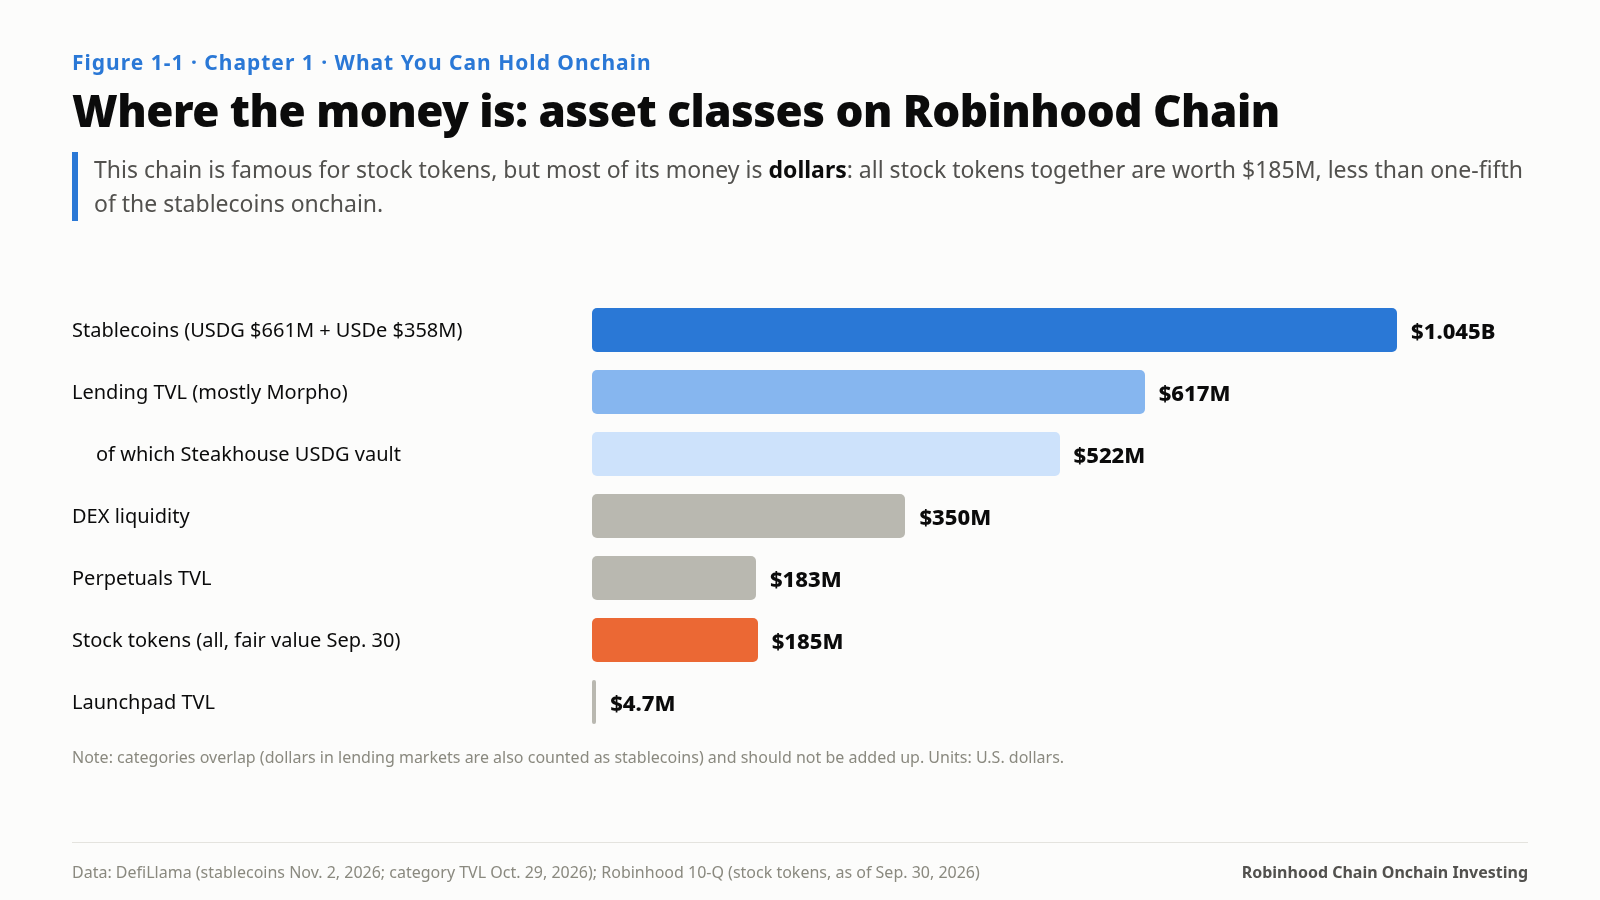
Robinhood Chain is famous for stock tokens, but its ledger is mostly dollars: about $1.045 billion in stablecoins, mainly lent out, against $185 million of stock tokens. This piece maps the chain's eight asset classes by source of return and exit speed, and walks through five common traps in reading its data: double counting, aggregator prices, the dividend multiplier, user-only rewards, and quotes that are not fills.
If you are looking at Robinhood Chain, whether to put money on it or to write a one-page view for clients or an investment committee, start with a quick test: what is the largest asset on this chain?
Most people say stock tokens. A U.S. broker put Apple, NVIDIA and the S&P 500 onchain, tradable 24 hours a day from almost any country. That is its loudest story.
The ledger says dollars. On November 2, 2026, the chain held about $1.045 billion in stablecoins against total value locked of about $1.083 billion. The largest single use was stablecoin lending: Morpho’s lending markets held about $620 million, about $522 million of it from a single vault. Robinhood’s 10-Q put the fair value of all its public stock tokens at just $185 million as of September 30.
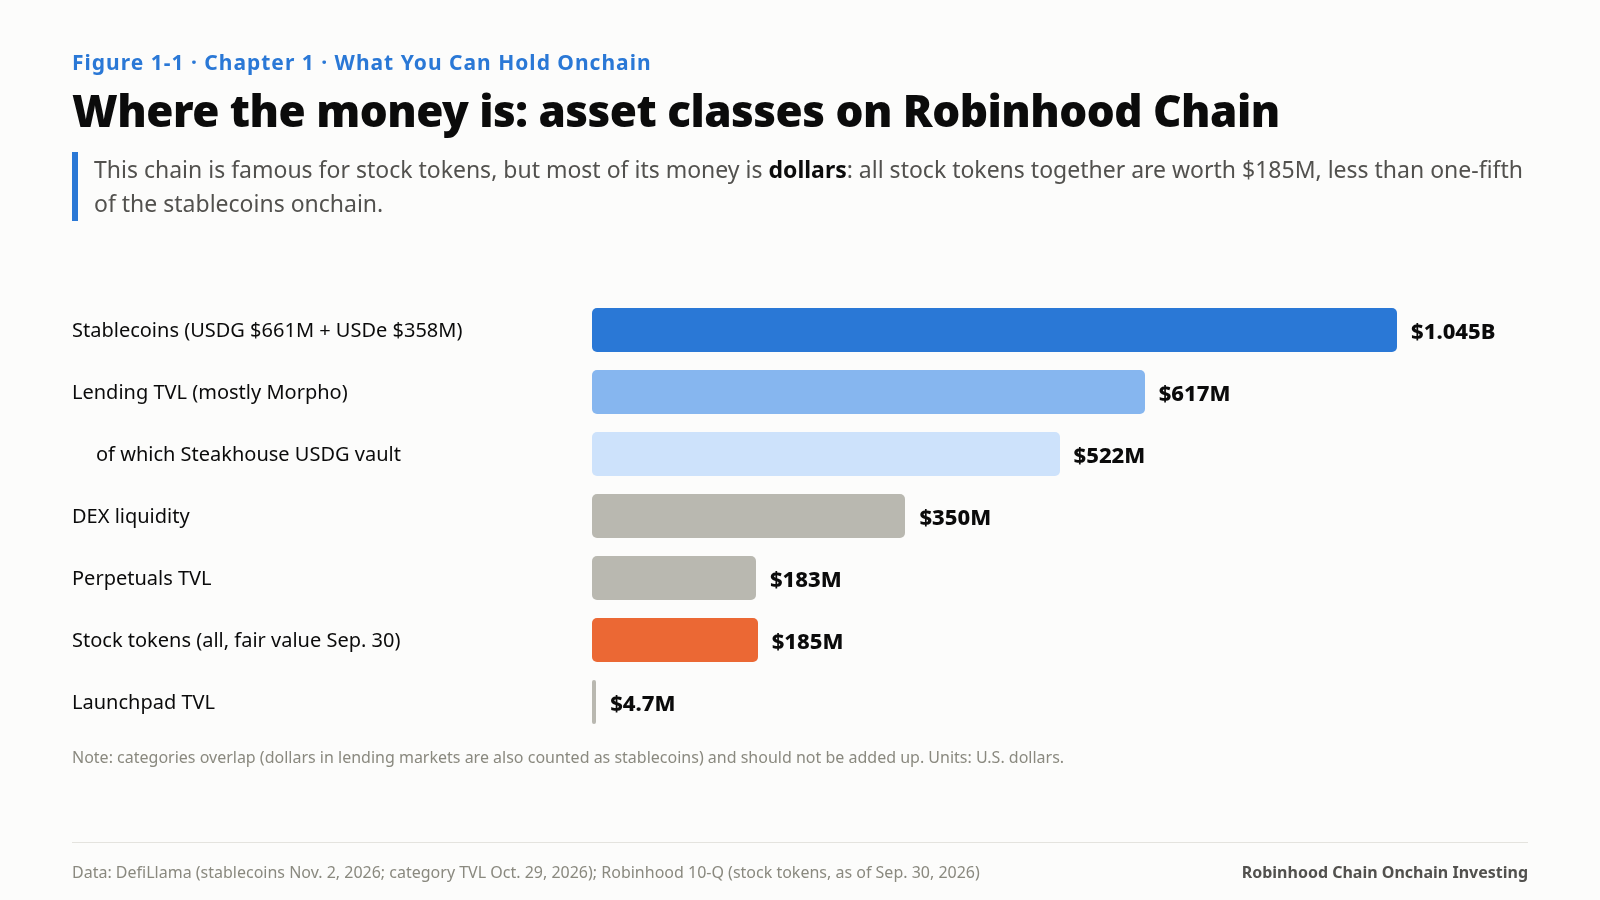
A chain famous for stocks is mostly dollars, and most of those dollars are earning interest. Everything else in this series builds on that.
Eight Asset Classes, Two Questions
What an investor can hold here falls into eight groups: stablecoins (USDG, USDe), lending receipts and vault shares, yield-bearing dollars (syrupUSDG, spUSDG, mGLO), stock tokens, LP shares, perpetuals, launchpad and ecosystem tokens, and early fixed-income and prediction products.
Their sizes differ by orders of magnitude. One Steakhouse-curated USDG vault holds $522 million; Pendle on this chain holds about $340,000.
Put them side by side and ask two questions:
- Source of return. Whose money are you earning? Borrowers’ interest, traders’ fees, longs’ funding payments, or someone’s subsidy?
- Exit speed. When something goes wrong, can you leave? Stablecoins in seconds; lending receipts depend on utilization; yield-bearing dollars take days to weeks; launchpad tokens may not get out at all.
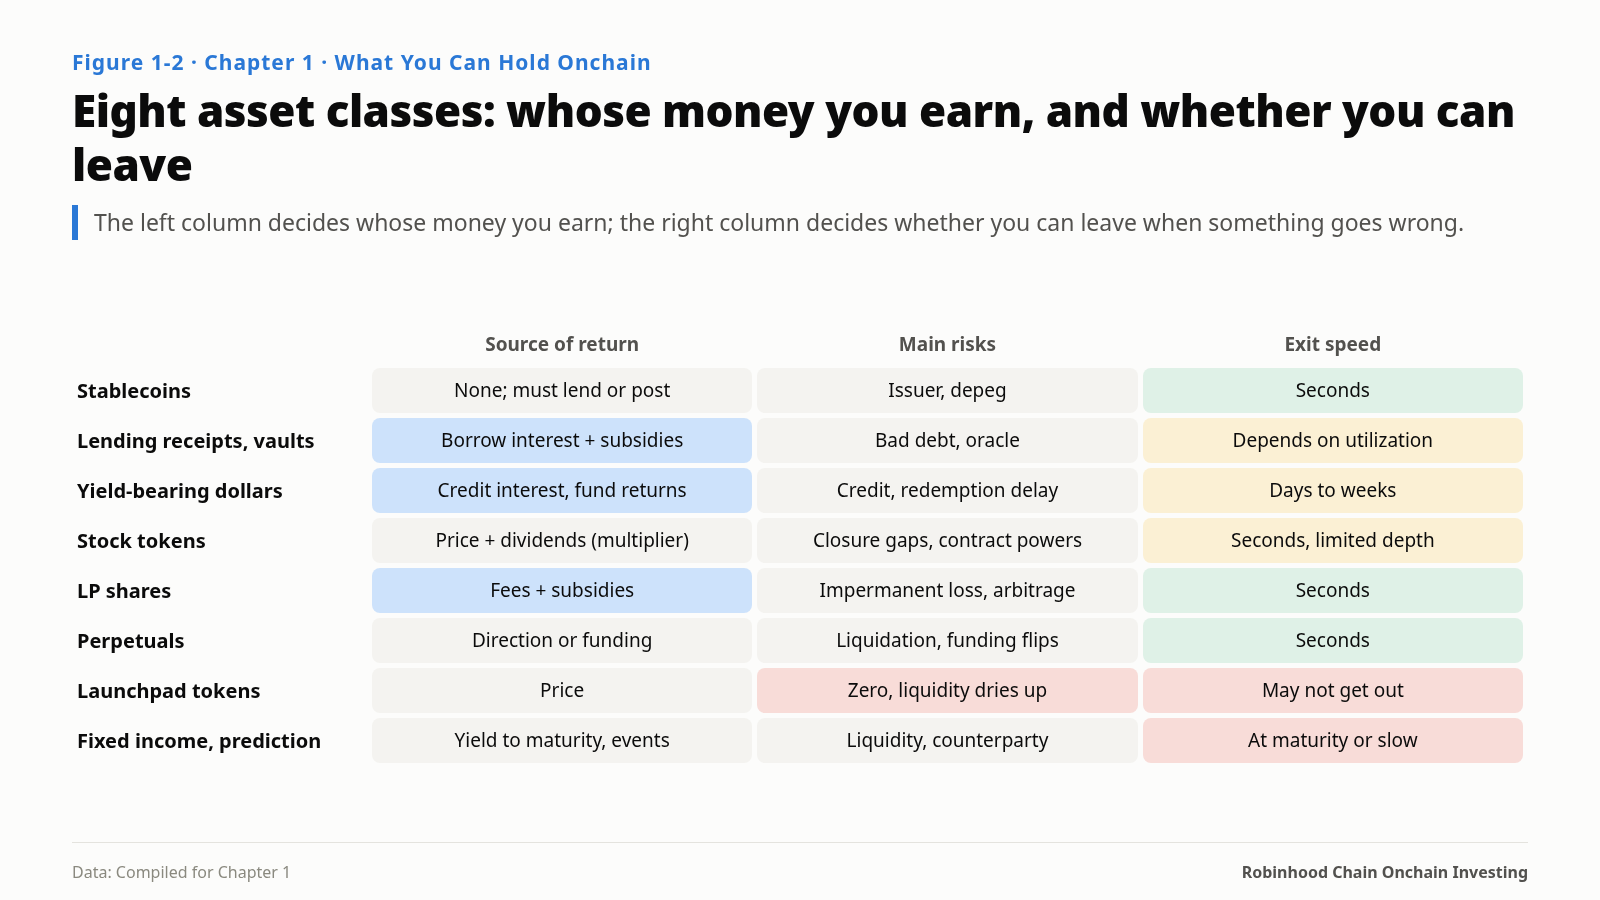
The left column decides whose money you earn; the right column decides whether you can leave. Those are the two lines worth writing down before you hold anything onchain.
One more fact that is easy to miss: stablecoins pay no interest on their own. USDG’s reserve income goes to Global Dollar Network partners, not to onchain holders, and the USDe on this chain is not the yield-bearing sUSDe. Every dollar yield onchain comes from handing your dollars to someone else. Who you hand them to is your risk.
Trading Fades; Deposits Don’t Necessarily
Mainnet launched July 1. DEX volume peaked at a weekly average of about $2.7 billion a day in early September and fell to $700–800 million a day by late October. Chain-operator fees were about $46.17 million in the third quarter and only about $1.55 million in all of October.
Over the same period, stablecoins rose from about $240 million in early July to about $1.09 billion by mid-September, then moved sideways between $1.05 and $1.1 billion.
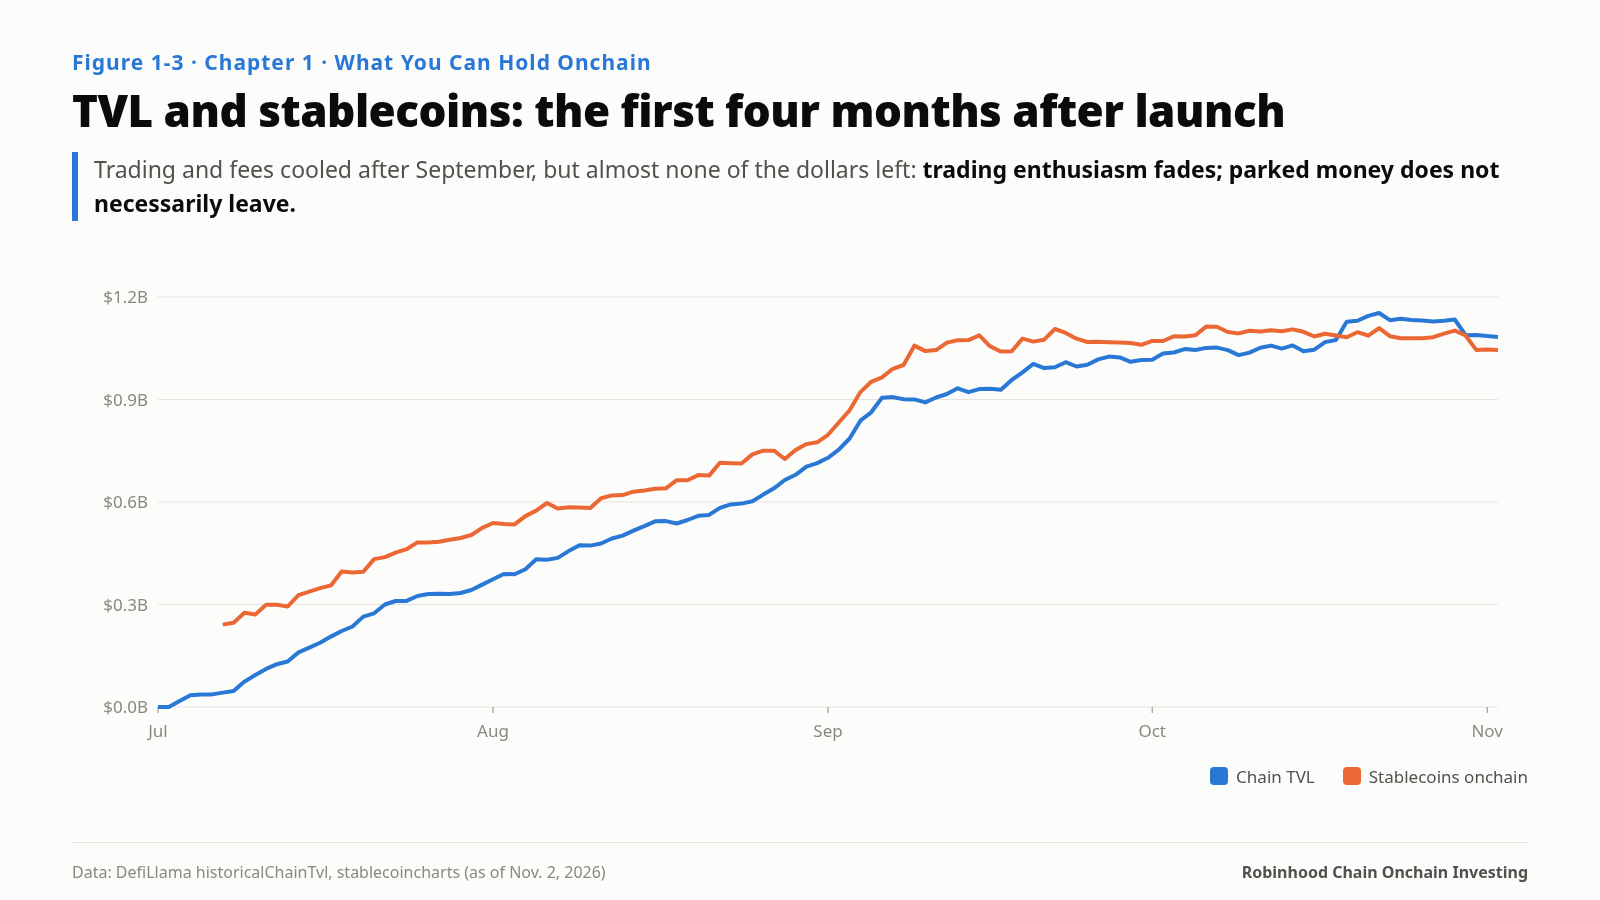
The trading enthusiasm faded; almost none of the dollars left. If you only watch volume and fees, the chain looks like it is cooling. If you only watch TVL, everything looks fine. Both views see half the picture: the billion dollars that stayed is earning interest, and to understand this chain you first need to know who pays it.
Before that, make sure the numbers you are reading are right.
Five Places Where the Data Lies
The same quarter’s DEX volume was about $90.67 billion by DefiLlama’s chain-level measure, “over $80 billion” in Robinhood’s earnings materials, and “over $100 billion so far” on the CEO’s earnings call. Onchain revenue was the same story: about $46.17 million in operator fees on DefiLlama, “over $50 million in onchain fees” from the company, and $26 million of net revenue attributed to Robinhood Chain in the financial statements.
None of these is wrong. They differ by time window, scope and gross versus net. The danger is comparing one measure against another.
On Robinhood Chain, I see five misreadings most often.
1. Double counting. On DefiLlama, Morpho Blue holds about $608 million on this chain and Steakhouse Financial about $541 million, together more than the chain’s entire TVL. They are the same money: Steakhouse curates the vault, and the vault’s funds sit in Morpho’s markets. Compare sizes using chain-level TVL or a single protocol, never by adding categories.
2. The aggregator’s price is not the onchain price. Pull SPY token quotes from Friday, October 23 to Monday, October 26, and you get only seven distinct prices in 72 hours, frozen all weekend. That is the reference price of the underlying share, which stops when U.S. markets close. On the same weekend, the onchain SPY/USDG pool kept trading at changing prices. Judge weekend risk from the reference price and you conclude there is none.
3. One token is not one share. Compare the SPY token’s onchain price with the share directly and the token is almost always a little more expensive, with a median around +20 basis points since mid-September. It looks like an onchain premium. The real reason is in the contract: Robinhood’s stock tokens pay dividends by raising a multiplier instead of paying cash. SPY’s multiplier moved from 1.0 to 1.001718 on September 17, so one token now represents 1.001718 shares. Multiply through and most of the “premium” disappears.
4. Half the APY belongs to someone else. The Steakhouse USDG vault yields about 7%, split into about 4.06% base interest and about 3.10% rewards. The rewards come from a Merkl campaign called “[Robinhood Users Only],” paid only to users who deposit through Robinhood. Deposit into the same vault from another wallet and you get the base rate only. The opposite misreading exists too: DefiLlama shows 0% for the syrupUSDG and mGLO markets because it measures the collateral side, while that collateral is appreciating on its own.
5. A quote is not a fill. Using Relay’s public quote API, moving $100,000 of USDC from Base into USDG costs about 6 basis points and settles in a second. Ask for $1 million and the API refuses: “exceeds the maximum fill of $500,000.” Stock-token pools are thinner still: the median of the last 300 trades in the main pools is $100 to $700, the largest about $12,000. A pool’s TVL is one thing; how far your $100,000 order moves the price is another.
The Framework: Calibrate the Ruler Before Reading It
All five traps share one feature: the number is right and the ruler is wrong. Inconsistent scope, inconsistent units, inconsistent price sources, inconsistent ownership of yield, and the gap between quote and fill.
So before I believe any striking finding, I ask three questions:
- Scope. What time window, what coverage, gross or net?
- Units. Are both sides the same thing? Is one token one share?
- Ownership. Whose yield or price is this, and can I actually get it?
While writing the book, about half of the findings that looked striking disappeared at this step. The other half were worth digging into.
If You Are About to Put Money Here
- Decide which kind of return you want. Price returns, interest, fees and funding carry completely different risks. Do not evaluate them together just because they live on one chain.
- Treat size as information. An asset class worth a few hundred thousand dollars usually means your trades will move the price; one worth hundreds of millions usually means someone is subsidizing it or there is real demand. Telling the two apart is the subject of the rest of this series.
- Check three kinds of data every week: size (chain TVL, stablecoins), price (DEX trades, not reference prices) and subsidies (Merkl campaign budgets and end dates). A subsidy’s end date belongs on your calendar more than its yield does.
This chain is famous for stocks but holds mostly dollars; its most visible activity is trading, but its most stable is interest. To understand it, don’t start with the yield. Start with the ruler.
Which of these traps have you hit when reading onchain data?
—Adapted from Where the Yield Comes From: An Investor’s Handbook for Robinhood Chain, Chapter 1, “What You Can Hold Onchain,” and Chapter 2, “The Investor’s Dashboard”
The full book (15 chapters, 42 figures): https://pickful.ai/books/dgpy
转发此帖子?
与您的关注者分享。
回复