
Contents (5)

·
Arenas and Foundations: Four Growth Paths for Launchpads, and 12 Metrics to Track Them Over Time
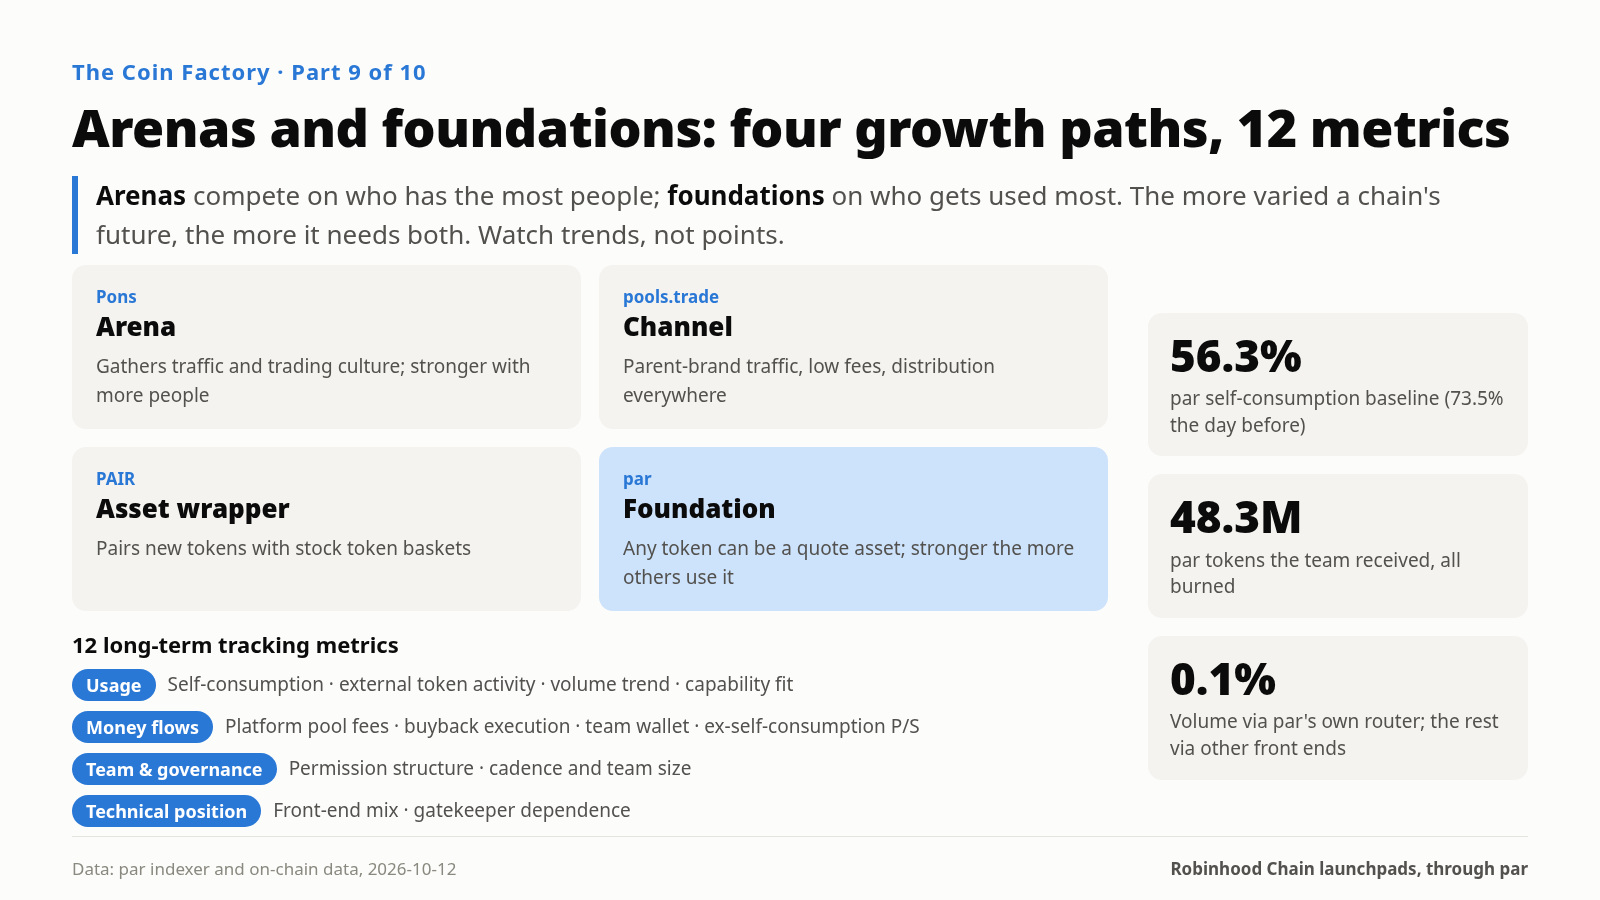
The series wrap-up: launchpads grow as arenas (more traders) or foundations (used by others). Four growth paths on Robinhood Chain — Pons, pools.trade, PAIR, par — and 12 public-data metrics for tracking any launchpad, with par's October 12 readings as a baseline.
If you’re forming a view on a sector’s long-term shape, or you plan to track a launchpad over time, this is the series’ wrap-up on the whole sector. The first eight pieces took apart front ends, technology, gatekeepers, fee splits, wallets and valuation. This one condenses them into two things: a map of paths and a checklist you can reuse. The next piece breaks down par’s toolbox on its own.
Not one race, several roads
Ranking Pons, pools.trade, PAIR and par by volume is the easiest mistake to make. Their technical choices, their positions in the seven-layer stack and the capabilities they’ve built are all different. They’re on different roads.
Arenas and foundations: launchpads grow in two basic ways. An arena gathers traffic and traders, and gets stronger the more people show up. A foundation gets used by other projects, communities and agents, and gets stronger the more it’s used. The two can coexist, and can even be combined in one platform.
| Arena: Pons | Channel: pools.trade | Asset wrapper: PAIR | Foundation: par | |
|---|---|---|---|---|
| Core value | The most active place to launch and trade | Uniswap’s brand, low fees, distribution everywhere | Pairing new tokens with baskets of stock tokens | Any token can be a quote asset; price floors, takeovers, programmability |
| How it acquires users | First mover, network effects, deep terminal integration | Traffic from the parent brand | Press releases, RWA narrative | Product capability, developer interfaces, multichain |
| What growth depends on | Sustained on-chain trading activity | Uniswap’s commitment to this business line | Stock tokens entering DeFi; oracle and issuer policy | Communities, projects or agents willing to use it as a tool; front-end integration |
No road is inherently better. If on-chain trading stays active, arenas benefit most. If stock tokens enter DeFi at scale, asset wrappers and foundations both benefit. If Robinhood Wallet brings everyday users on-chain, brand and front-end access matter most. If AI agents become the main issuers, a programmable foundation is the closest fit.
What the foundation model is
Of the four roads, the foundation needs the most explaining, because it’s furthest from most people’s picture of a launchpad.
par lets any token with enough liquidity serve as the quote asset for a new token, with at least 5 ETH of depth at each hop. Add two more features: a floor wall, which turns fees into a buy wall in the pool that only ever moves up; and community takeover, which lets a community redirect fees on a token its original developer abandoned.
Combined, it can give an existing community three things. Utility: the community can launch child tokens quoted in its own token, and buying any child token means buying the parent first. A floor: the child token’s fees can build a floor wall in the pool quoted in the parent token. Revenue: child token fees can flow back to an address the parent community designates.
The model is neutral. It provides utility for any token, including tokens from other launchpads; par’s pricer even has a built-in adapter for Pons. So foundations and arenas are more likely to complement each other than to replace each other.
It has two questions to answer. One is the scale of that utility: child tokens usually trade far less than the parent, so there need to be enough of them, active enough, to matter for the parent. The other is that the protocol holds and sells some of the quote asset: by the rules, child token trading brings the parent 100% on buys and about 0.25% on sells. The net effect is buy pressure, but that ratio should be stated plainly in the marketing.
12 long-term metrics
Every metric can be checked with public data. The readings are par’s sample on October 12, meant as a baseline, not a conclusion. Watch the trend, not a single point.
Group one: usage
- Self-consumption ratio: platform token volume ÷ total platform volume. A steady decline means the platform is shifting from trading itself to being used by others. Reading: 56.3% over 24 hours (73.5% the day before), 64.4% cumulative.
- Ongoing activity in external tokens: the share of recently launched tokens still trading a few days later. Reading: of the last 500 launches, 94 traded in the past 7 days (18.8%) and 30 in the past 24 hours (6.0%).
- Volume and fee trends: the platform’s share of chain-wide volume says more than absolute numbers. Launching is nearly free, so launch counts only measure how many people came to try. Reading: about 7.78 ETH of platform volume over 24 hours, 2 new launches; 3,460 launches cumulative.
- Capability fit with future demand: profile against the eight capabilities. Reading: has RWA pairing, programmability, DeFi composability, social distribution and multichain; partially has safety and transparency, fair launch and terminal access.
Group two: money flows
- Where the platform token’s own pool fees go: the more they point at buybacks, burns or a public treasury, the more direct the link. Reading: the half denominated in the platform token is burned in full, nearly 90% of the token’s cumulative burns; the ETH half (55.53 ETH) is operating revenue. The creator fee recipient is transferable, so one transaction could route it into buybacks.
- How buybacks run and how much they actually spend: contract-enforced or manual; whether buybacks grow with external volume. Reading: the buyback wallet executes hourly, 360 times and 7.49 ETH cumulative, all public; about 0.049 ETH in the past 7 days.
- Team wallet asset conversions: when and how much went into stablecoins, and whether any platform tokens were sold. Reading: not one platform token sold, all 48.3 million burned; 40 ETH converted to 98,644 USDG as an operating reserve, still in the wallet; books balance.
- Ex-self-consumption P/S: market cap ÷ annualized external protocol revenue, annualized from 7-day data. Reading: about 38x on October 11, about 16x on October 12. Single readings swing a lot; use as a reference only.
Group three: team and governance
- Permission structure: whether the factory owner, fee recipient and buyback executor are multisigs, and whether there’s been an audit. Reading: the token contracts themselves have no admin at all; no minting, pausing or blacklisting. The factory owner, fee rights and splitter treasury currently sit in the team wallet, with buybacks in a separate wallet; the docs state there’s no audit yet. Moving to a multisig and completing an audit are upgrade signals that would be visible within a few steps.
- Communication cadence and team size: how often updates come, and whether the focus is features or distribution. Reading: single developer; a long post on October 5 said the focus would shift to distribution.
Group four: technical position
- Front-end mix: which router contracts volume comes from. Reading: of the latest 2,000 trades in the platform token’s main pool, about 39.4% went through 0x’s settlement contract, about 40% of which were orders from the trading terminal FOMO via Relay, or about 15% of the main pool; par’s own router accounts for 0.1%.
- Dependence on gatekeepers: whether fee upgrades need outside approval, how many tokens are quoted in stock tokens, whether anti-sniping depends on current sequencing rules. Reading: V2 is waiting on hook approval; anti-sniping is only the dev buy in the launch transaction; stock token quoting is allowed, so tokens inherit the issuer’s pause, blacklist and admin-burn powers.
How to use these readings
par’s readings capture a particular moment: day 38 after launch, at the tail end of the chain’s first phase. They’re best used as a baseline.
Team behavior (metric 7) already gives a clear, verifiable reading.
Improvements in governance and money flows (metrics 5, 6 and 9) don’t need new code, just a few on-chain transactions, and any change will show up on-chain quickly.
Usage (metrics 1, 2 and 3) depends on how fast the whole chain moves into its second phase. Check it quarterly.
Technical position (metrics 4, 11 and 12) depends on product direction and the gatekeepers. It changes the slowest and says the most about long-term prospects.
Zoom back out to the chain: stablecoins grew from about $240 million in early July to about $1.1 billion; stock tokens are available in 120+ countries, and Robinhood explicitly encourages putting them into lending and collateral; AI agent platforms have made this their default launch chain. Next-phase demand will be more varied than phase one. Beyond memes, there’s creating utility for stock tokens, giving agents an issuance interface and giving everyday users a safe, transparent place to issue. The next phase’s landscape depends on whose capabilities line up with those needs.
Closing
Arenas compete on who has the most people. Foundations compete on who gets used the most.
The more varied a chain’s future, the more both are needed at once.
When you track a launchpad, don’t just ask how much it’s up or how many tokens it launched. Ask who’s using it, where the money flows, and what it has prepared for the next phase.
Of these 12 metrics, which one do you think best predicts where a launchpad is headed?
— Excerpted from Chapter 10, “Arenas and Foundations: Four Growth Paths,” and Chapter 12, “Watchlist: 12 Metrics for Tracking a Launchpad,” of The Coin Factory
Repost this post?
Share with your followers.
Reply