
目录(8 节)

·
Robinhood's Half-Month Data: The Money Stayed. The People Are Still Leaving.
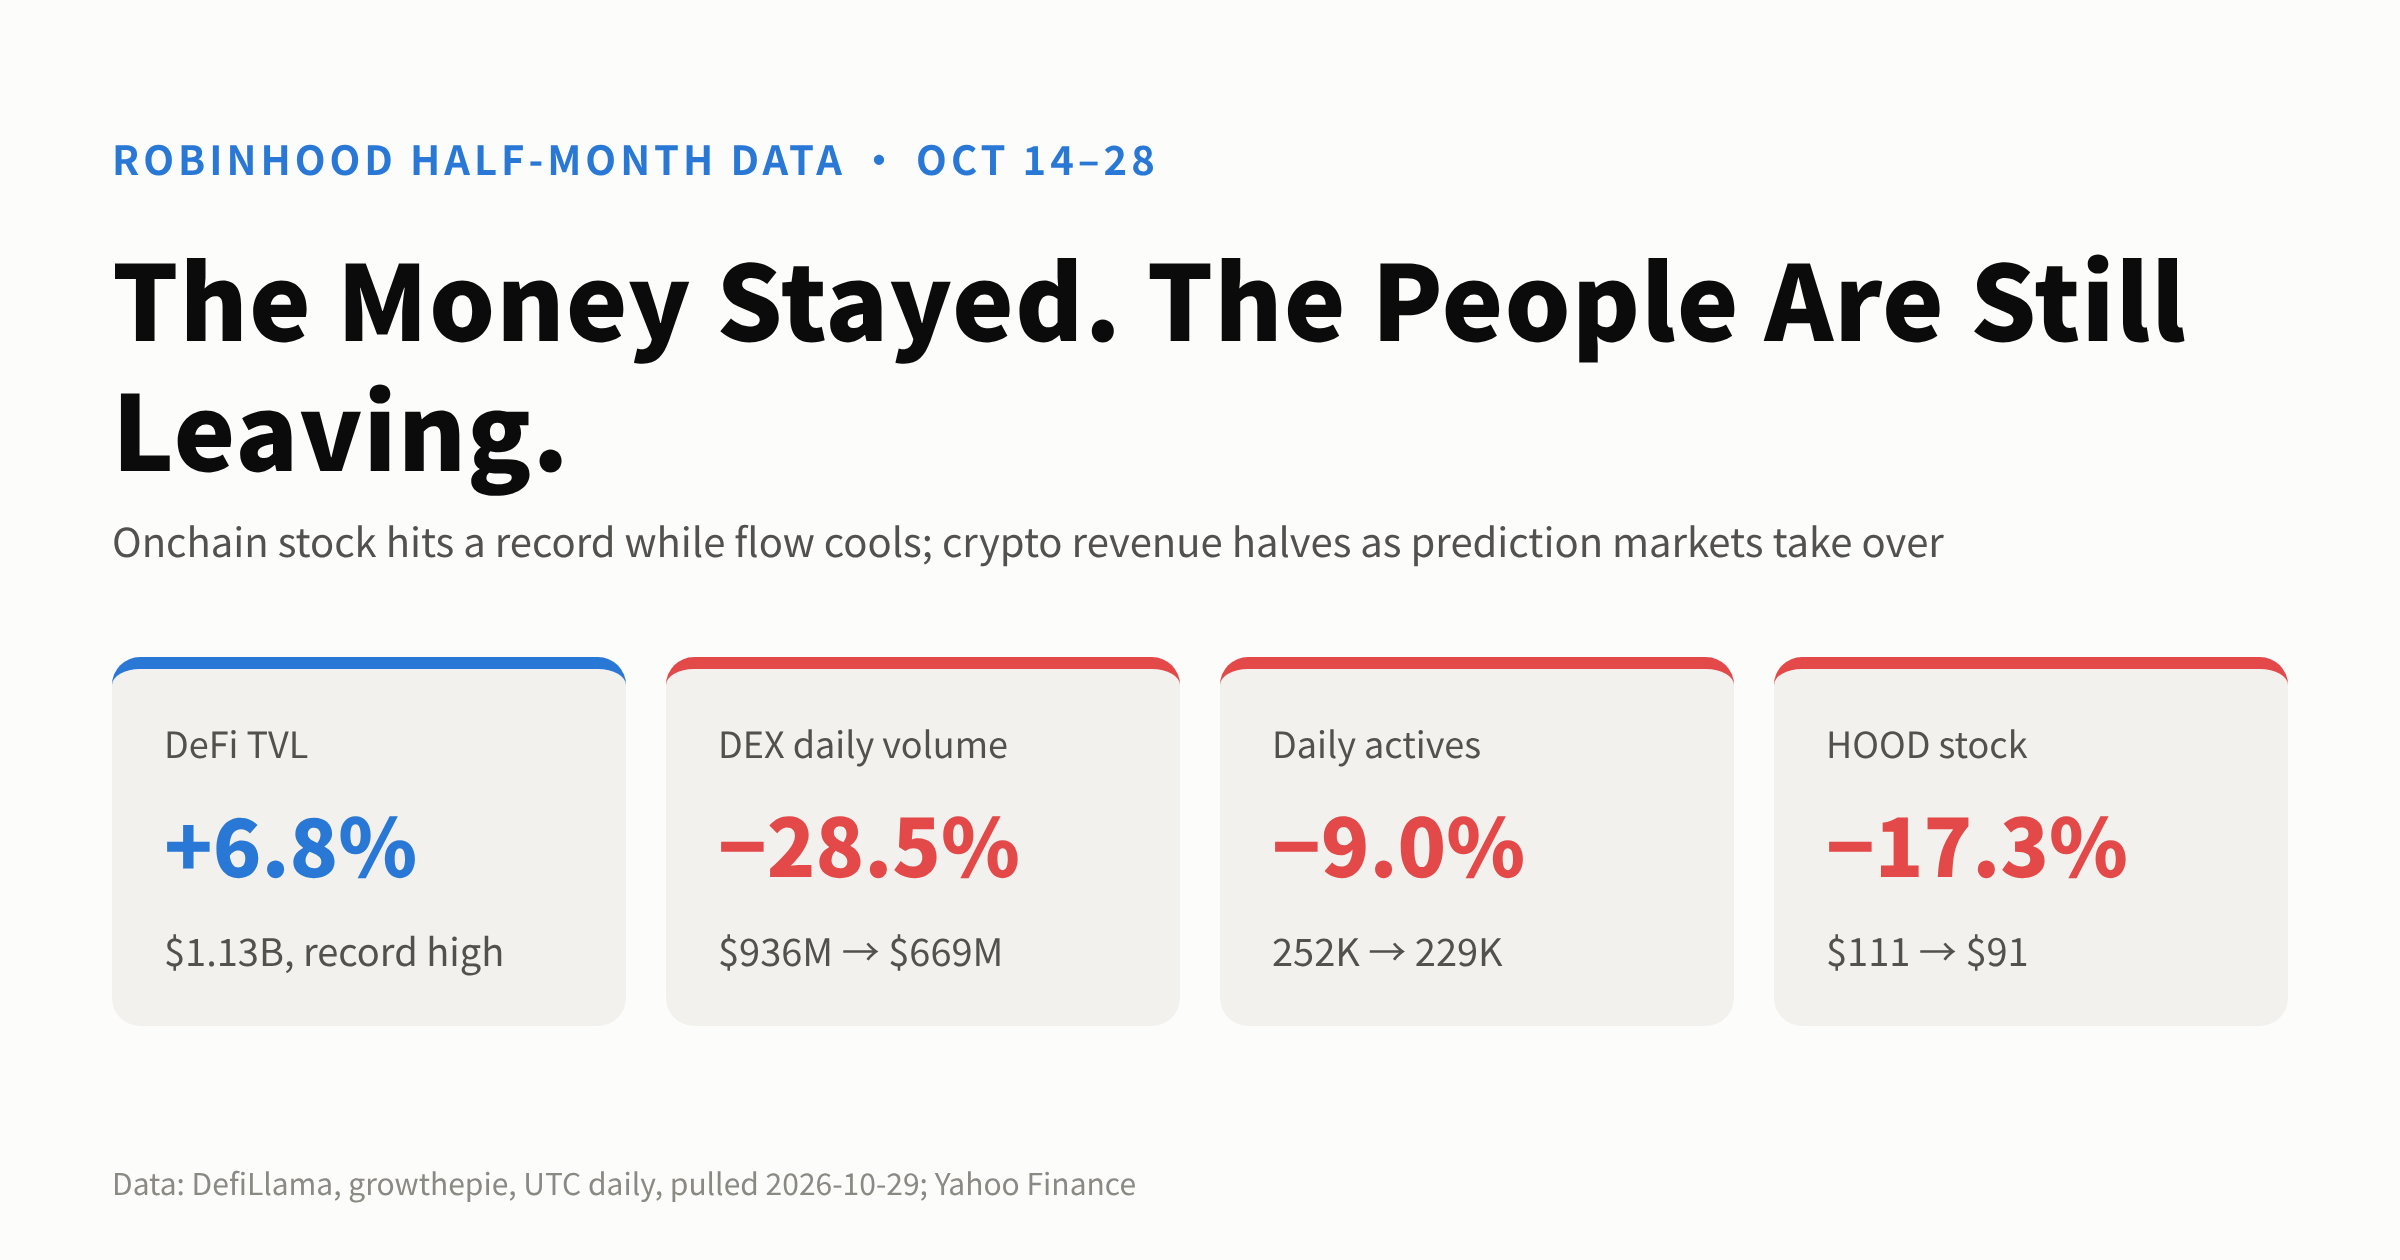
Onchain DeFi deposits hit a record while trading and daily actives fell together. Crypto revenue halved and the stock fell 17%, yet deposits set a record and prediction markets now out-earn crypto. Reading Robinhood's two weeks through the stock–flow scissors.
If you work at a broker, a payments company or an asset manager and are weighing whether to launch your own chain, Robinhood is the only live case to compare against. Over the past half-month (Oct 14–28) it handed in two report cards at once: one onchain, one in its earnings release.
Read together, they say one thing: the money stayed, and the people are still leaving.
Onchain DeFi deposits hit a record while trading and daily actives fell together. At the company level, crypto revenue halved year over year and the stock fell 17% in two weeks. Yet deposits set a record, and prediction markets now earn more than crypto.
1. Last issue’s three numbers
The Oct 20 weekly ended with three numbers to watch and said a real recovery needed all three. Time to check.
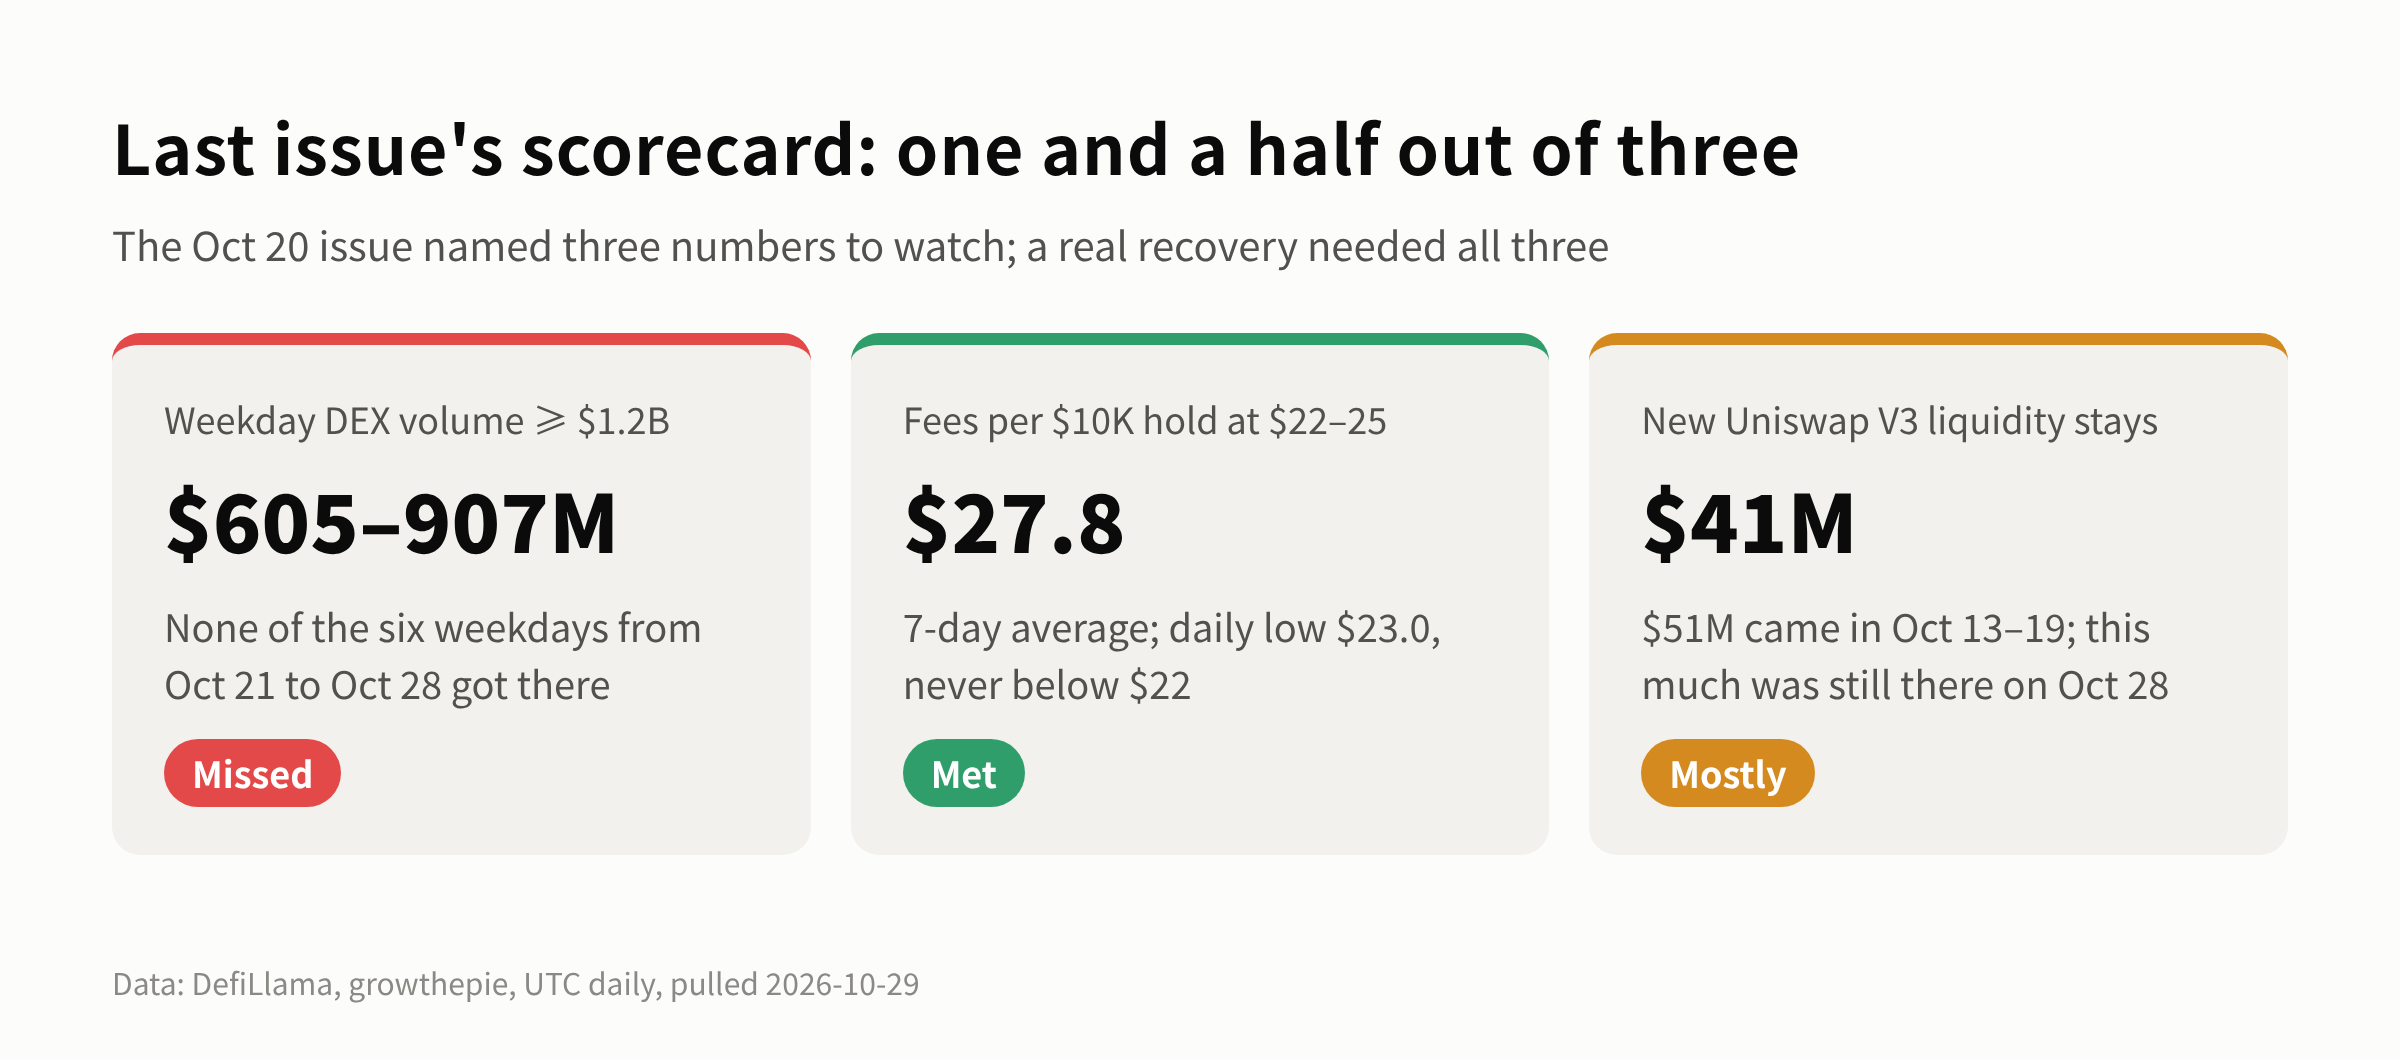
- Weekday DEX volume ≥ $1.2B: missed. The six weekdays from Oct 21 to Oct 28 ranged from $605M to $907M. None got there.
- Fees per $10K of volume holding at $22–25: met. The 7-day average was $27.8, with a daily low of $23.0.
- Is the new $50M+ in Uniswap V3 still there: mostly. $51M came in between Oct 13 and Oct 19; about $41M was still there on Oct 28.
One and a half out of three. The recovery the last issue was looking for did not arrive. But something more interesting did.
2. The half-month thermometer: stock up, flow down
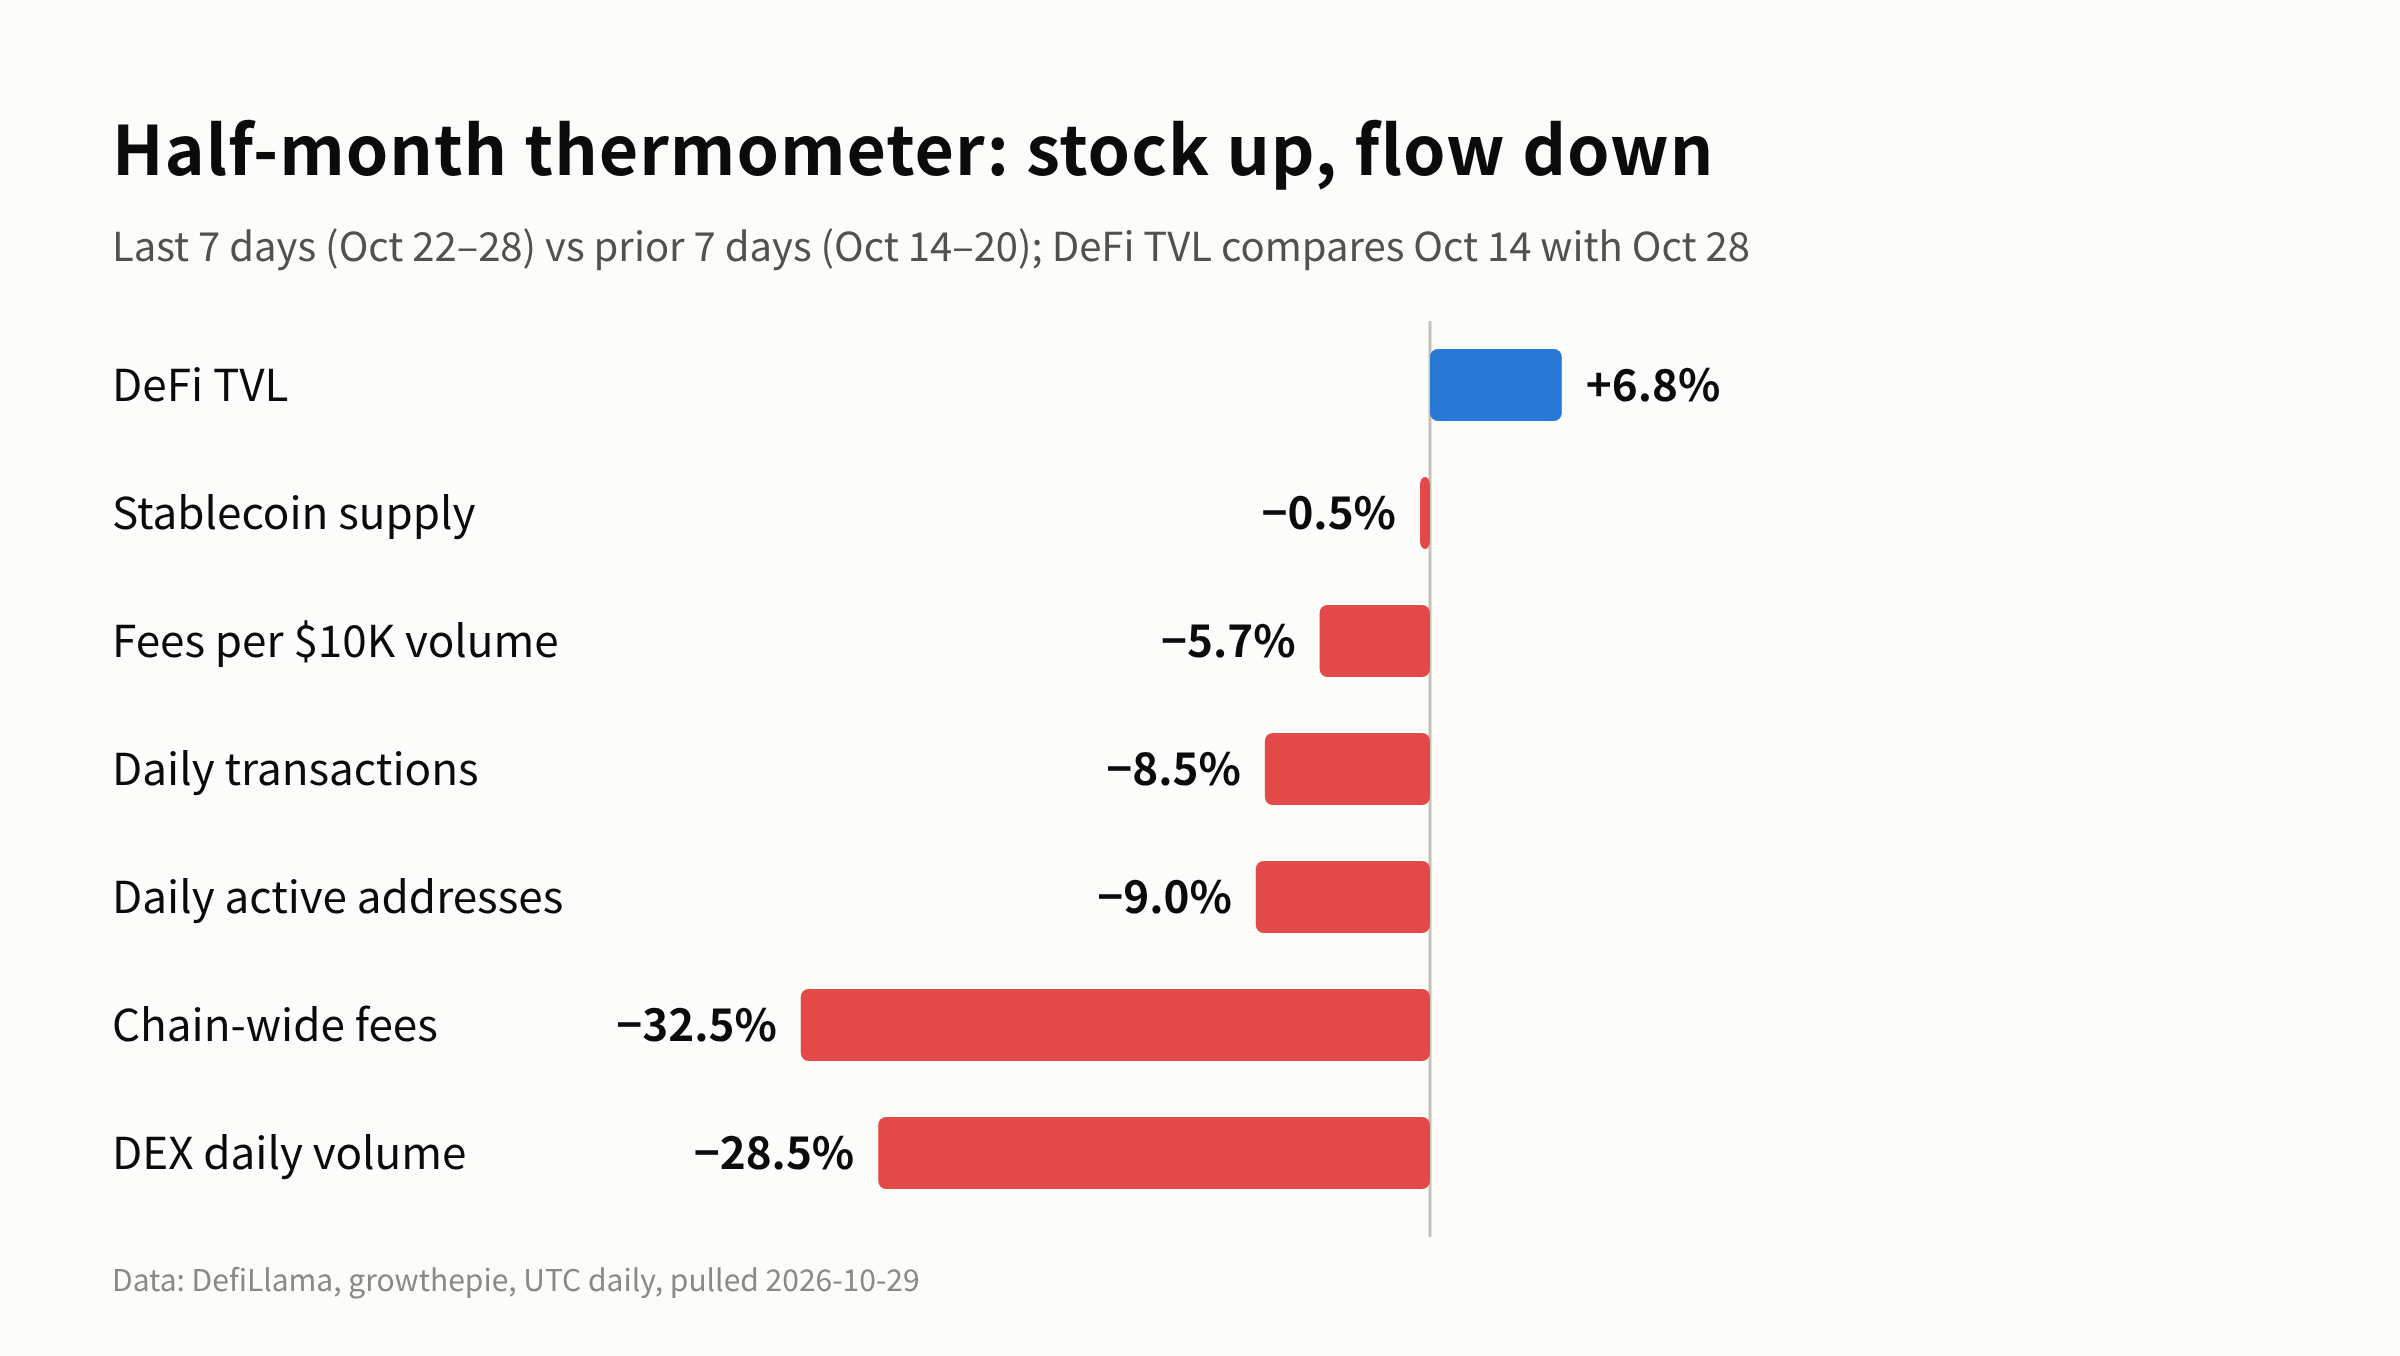
The last 7 days (Oct 22–28) against the prior 7 (Oct 14–20):
| Type | Metric | Prior 7 days | Last 7 days | Change |
|---|---|---|---|---|
| Stock | DeFi TVL | $1.058B (Oct 14) | $1.131B (Oct 28) | +6.8%, record |
| Stock | Stablecoin supply (daily avg) | $1.092B | $1.087B | −0.5% |
| Flow | Daily transactions | 6.50M | 5.95M | −8.5% |
| Flow | Daily active addresses | 252K | 229K | −9.0% |
| Flow | DEX daily volume | $936M | $669M | −28.5% |
| Revenue | Chain-wide daily fees | $2.75M | $1.86M | −32.5% |
One side up, the other side down, in neat formation. I call this the stock–flow scissors:
- Stock is money that sits on the chain, such as TVL and stablecoins. It tells you whether capital trusts the chain.
- Flow is activity on the chain, such as transactions, daily actives and volume. It tells you whether users treat the chain as a place they use every day.
Every new chain has to cross this line after its cold start. Stock and flow rising together is a bull market. Falling together is an ebb. Only one rising means the chain’s role is changing.
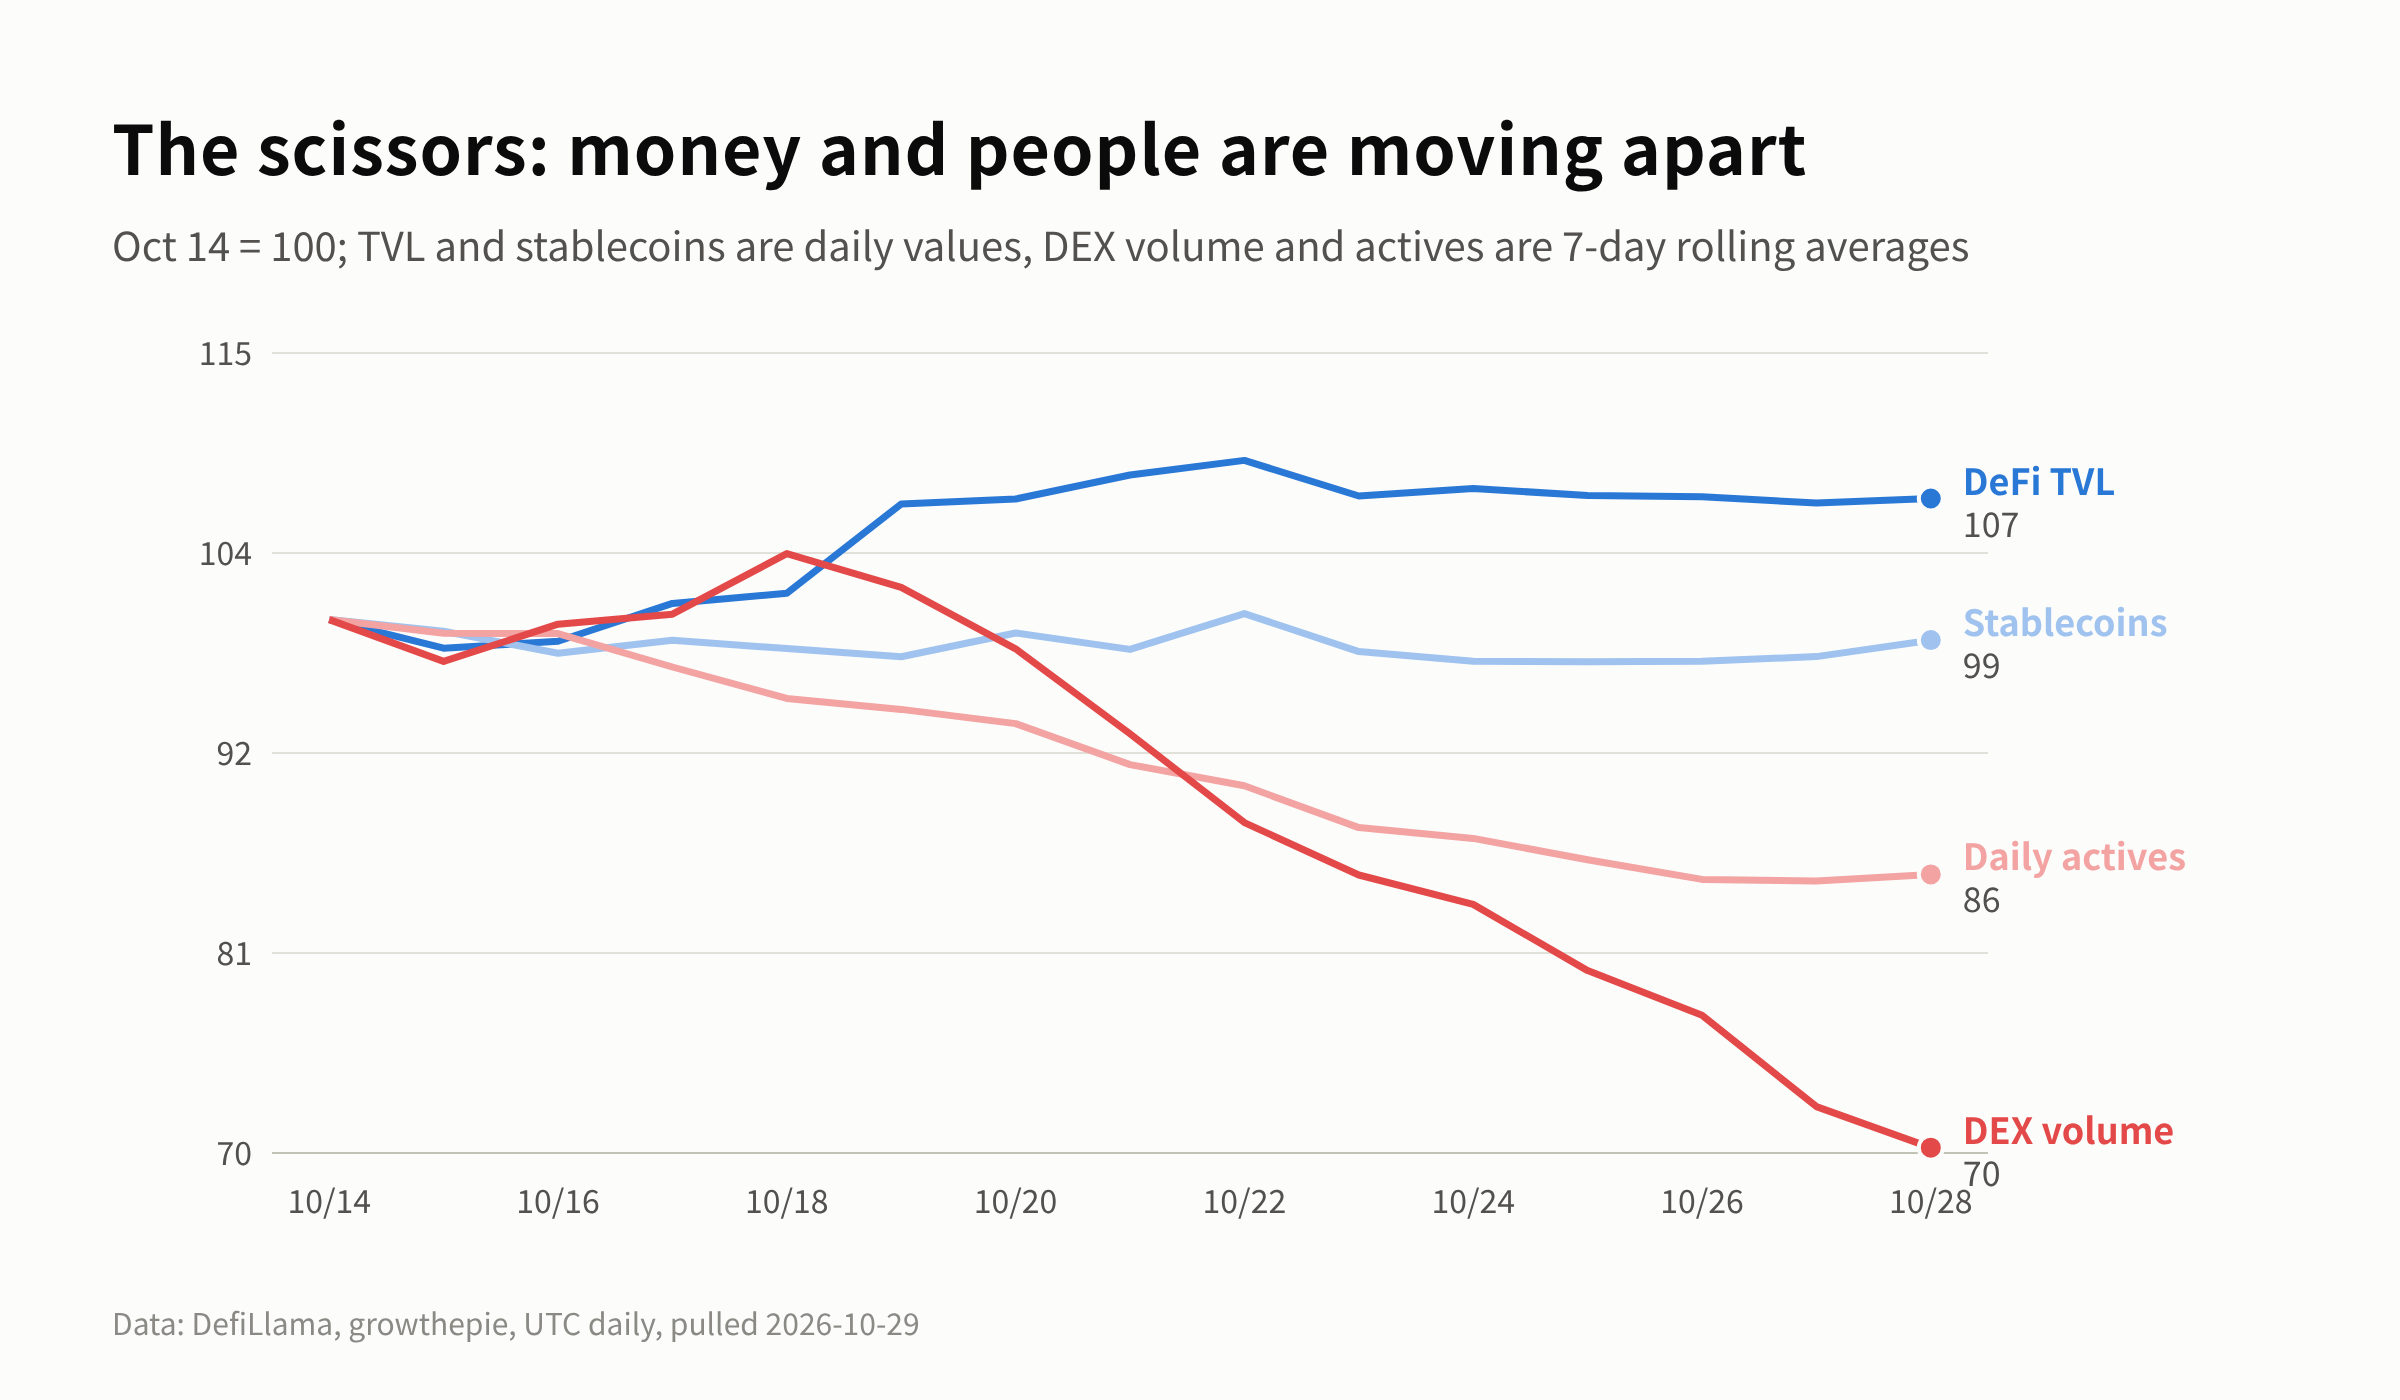
With Oct 14 set to 100, two weeks later DeFi TVL stands at 107, stablecoins at 99, daily actives at 86, and DEX volume at just 70. The blades opened around Oct 19.
3. Money: into market-making pools, not deposits
Break the roughly $72M of new TVL down by protocol:
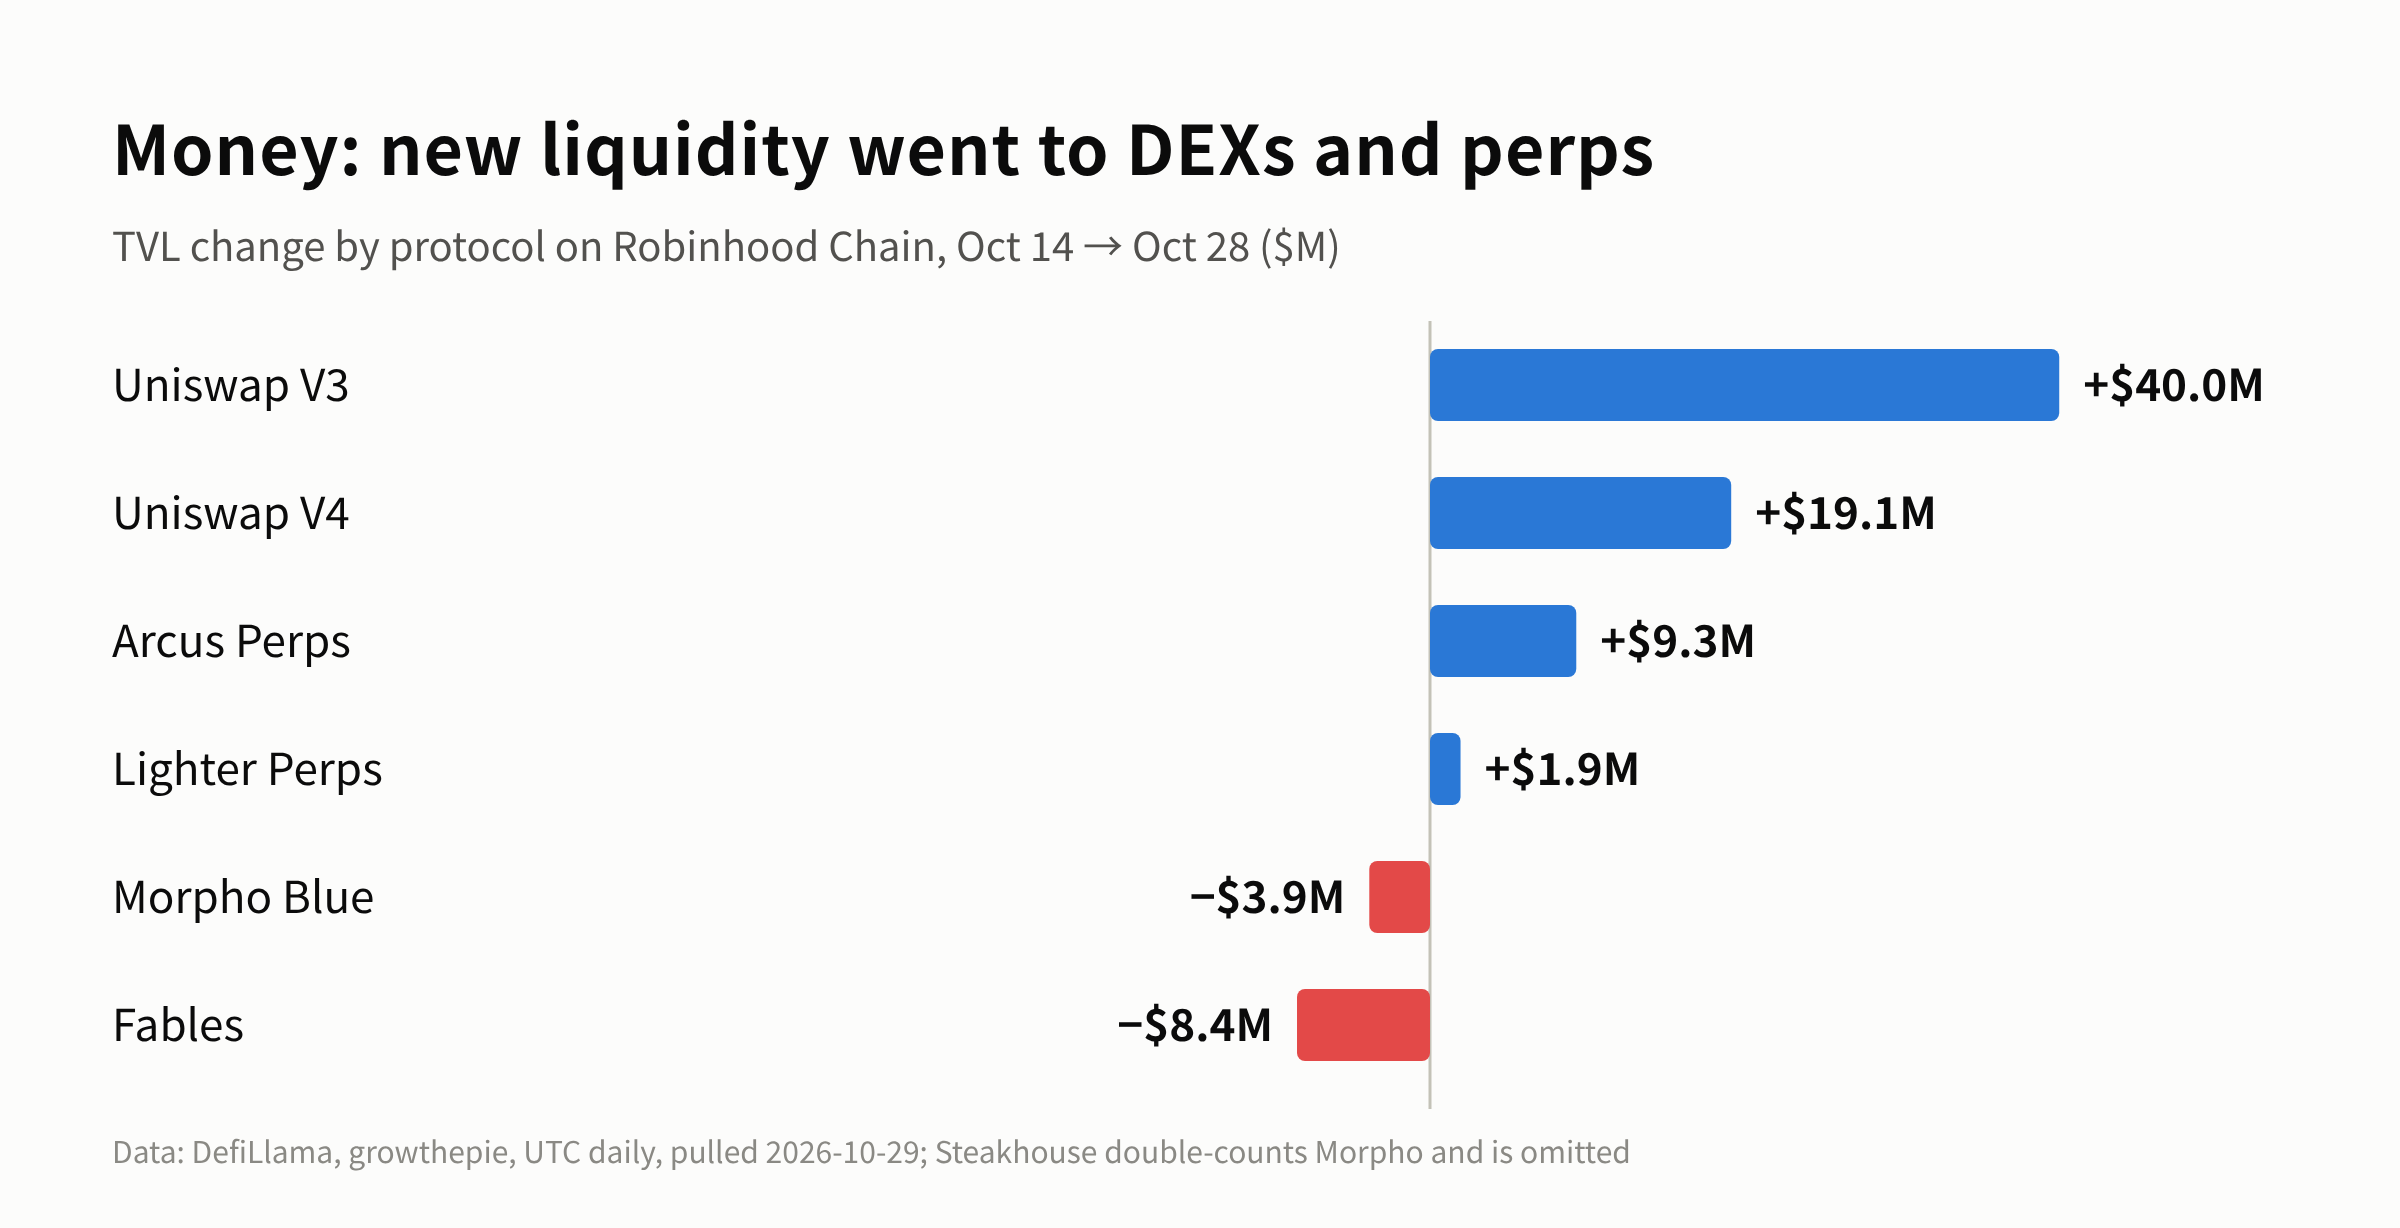
Uniswap V3 and V4 together added about $59M, around 80% of the net increase. Arcus Perps added $9.3M and has been climbing since late September. Morpho, the deposit base, lost $3.9M, and the meme launchpad Fables lost $8.4M.
That matches the structure from the last issue: money is going into liquidity pools, not launchpads and not deposits. People who add liquidity are betting that volume will come. Over these two weeks volume fell instead, so the bet has not paid off yet. Whether that $41M in V3 stays or leaves will be an earlier signal than the TVL total.
4. People: daily actives down 54% from the September peak
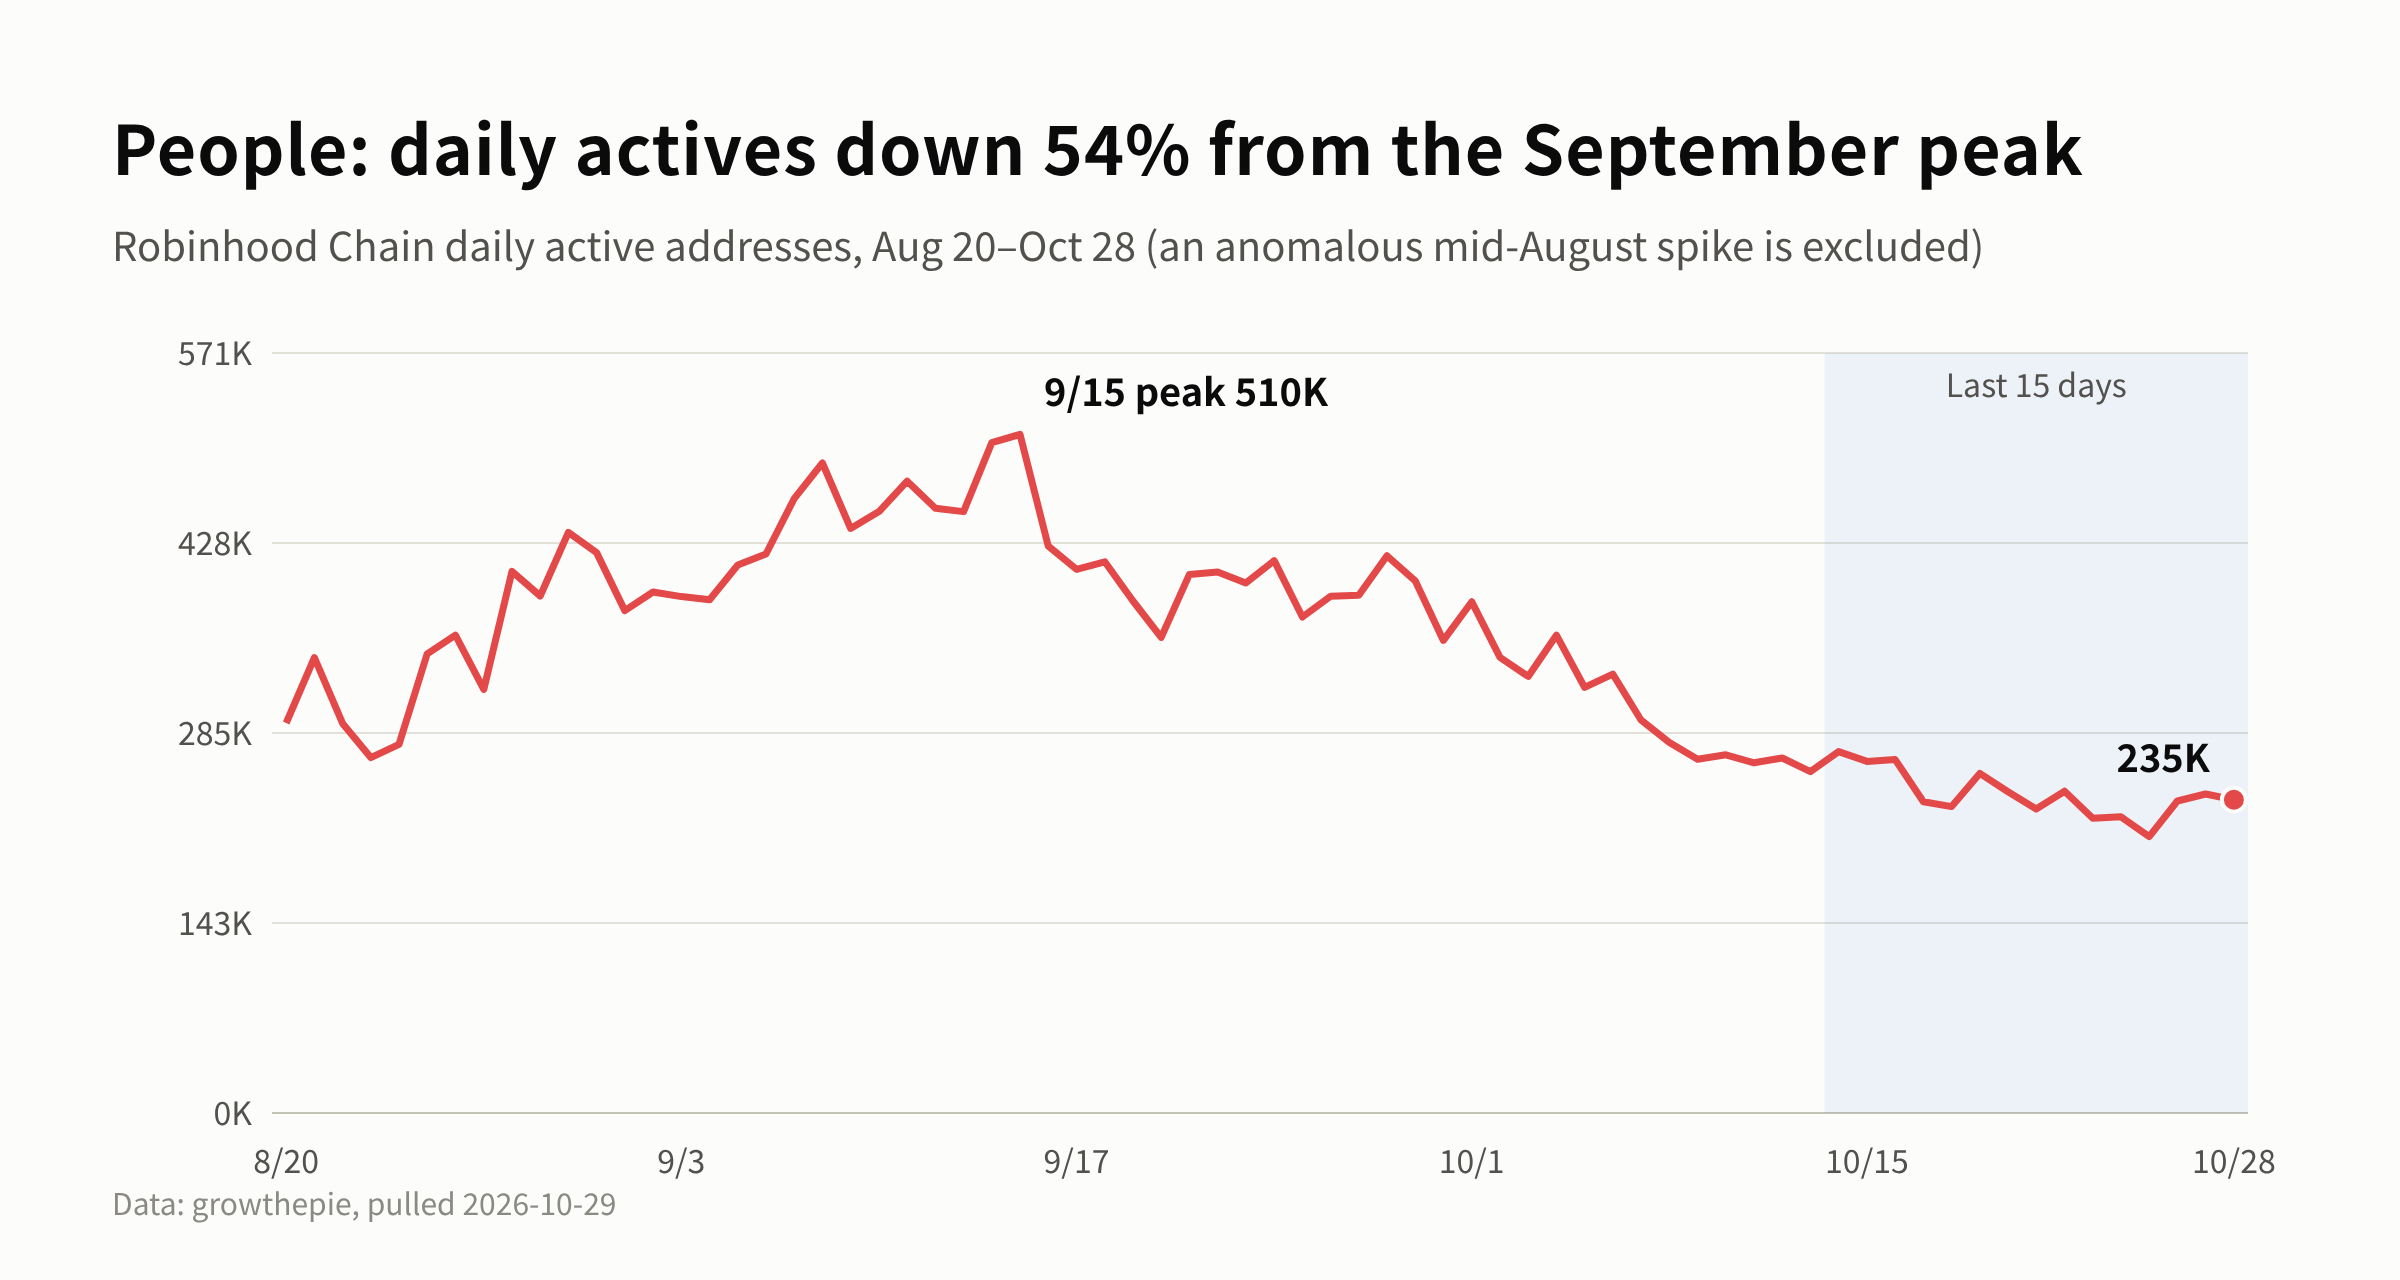
The longer view is clearer. Daily active addresses peaked at 510K on Sep 15 and have fallen almost without pause since. On Oct 28 the figure was 235K, down 54%, below late-August levels.
DEX volume tells the same story:
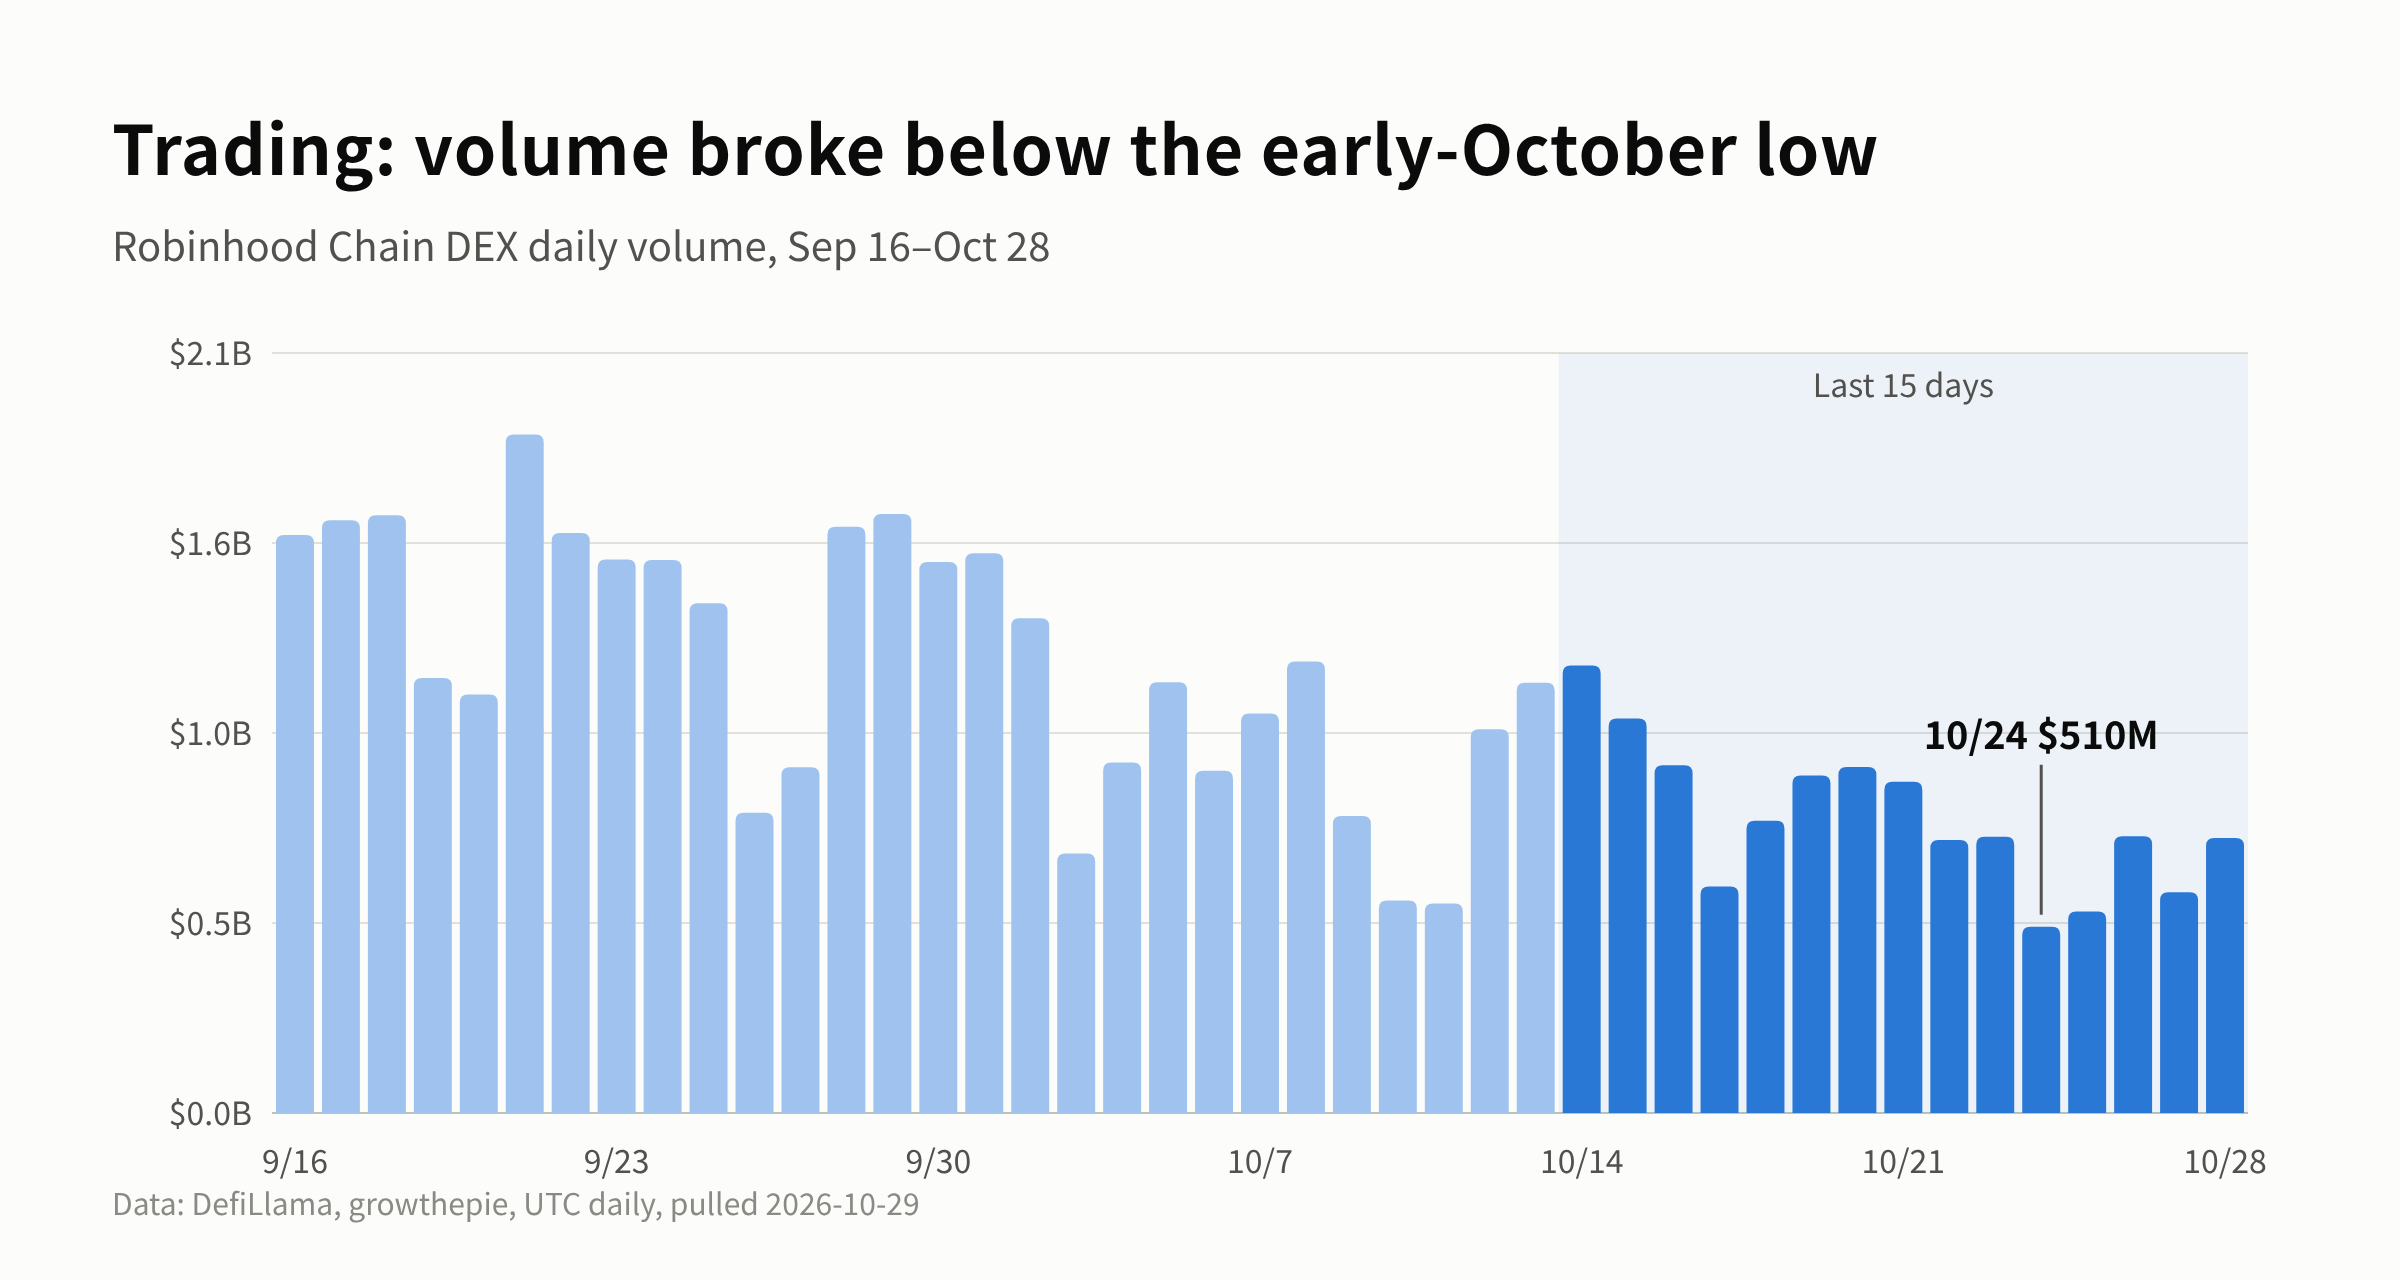
In mid-to-late September the chain did $1.5–1.8B a day. On Oct 24 it did $510M, below the early-October low.
Two things need separating here. Falling actives mean fewer people are showing up, mostly short-term traders leaving as the meme wave fades. But the people left and the money did not follow them. For a chain only a few months old, hot money leaving is a stage it has to pass through. The real question is whether the money that stayed will bring volume back.
5. Fees: the rate held, the total didn’t
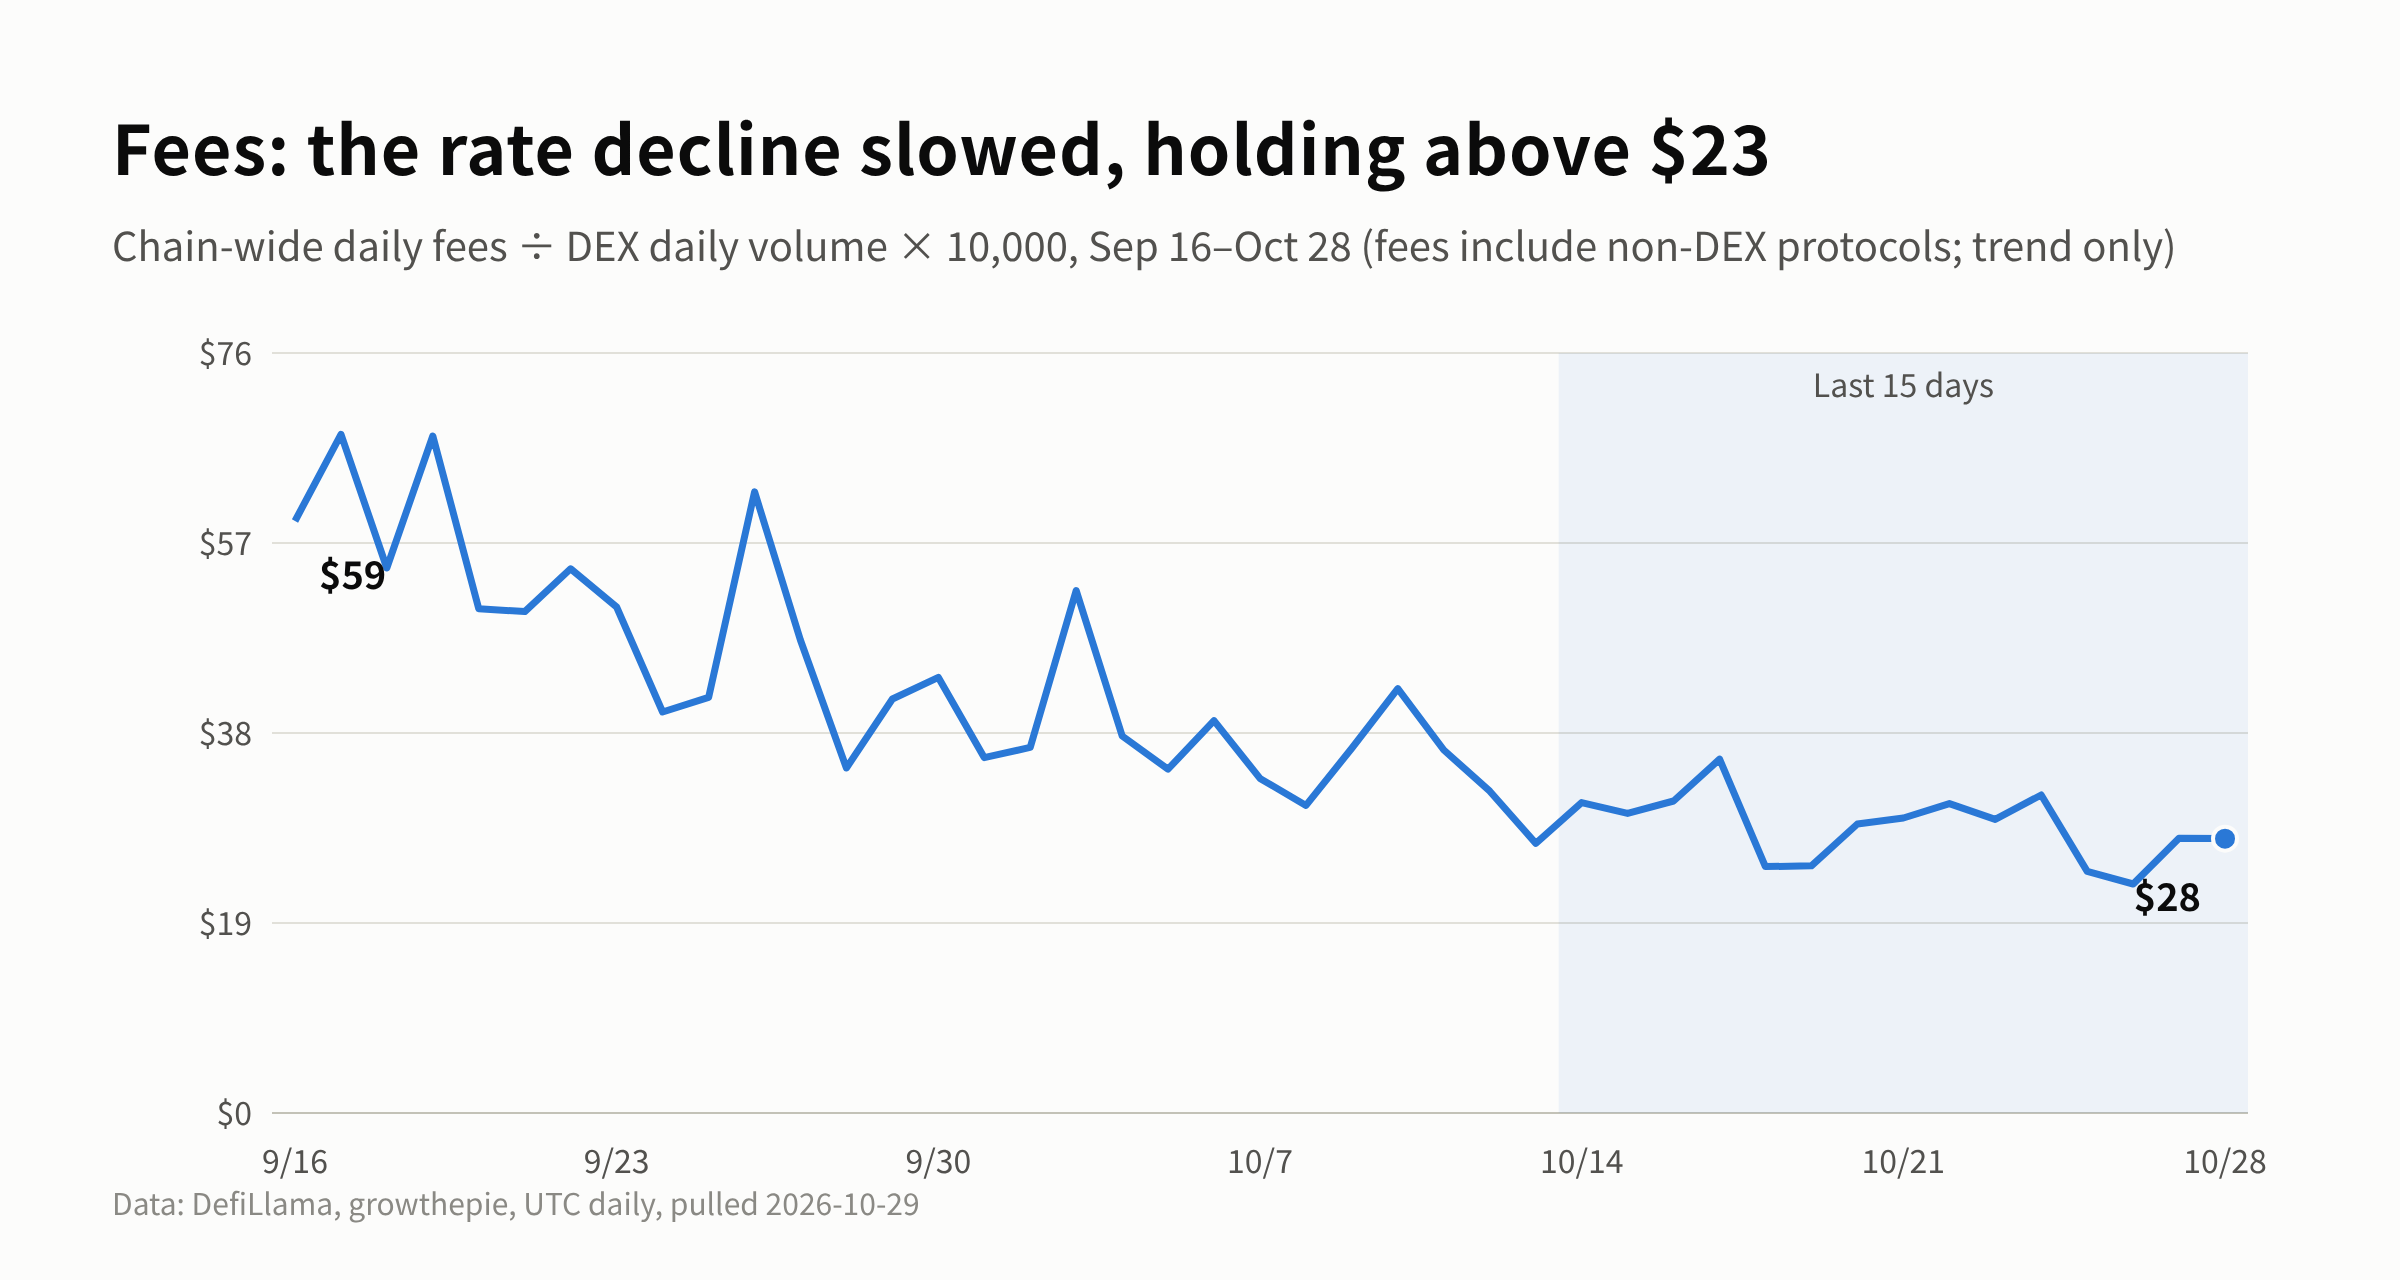
Fees per $10K of volume fell from $50–70 in mid-September to about $30 by mid-October. Over the past two weeks they moved sideways between $23 and $35. The decline has clearly slowed.
So the 32.5% drop in chain-wide fees is not mainly about earning less per trade. It is about fewer trades. That cuts both ways. A floor in the fee rate suggests the low-fee, large-ticket structure is largely in place. But if volume doesn’t come back, there is nothing else to make up the revenue.
6. The company: crypto revenue halved, prediction markets take over
Away from the chain, Robinhood reported Q3 results on Oct 27.
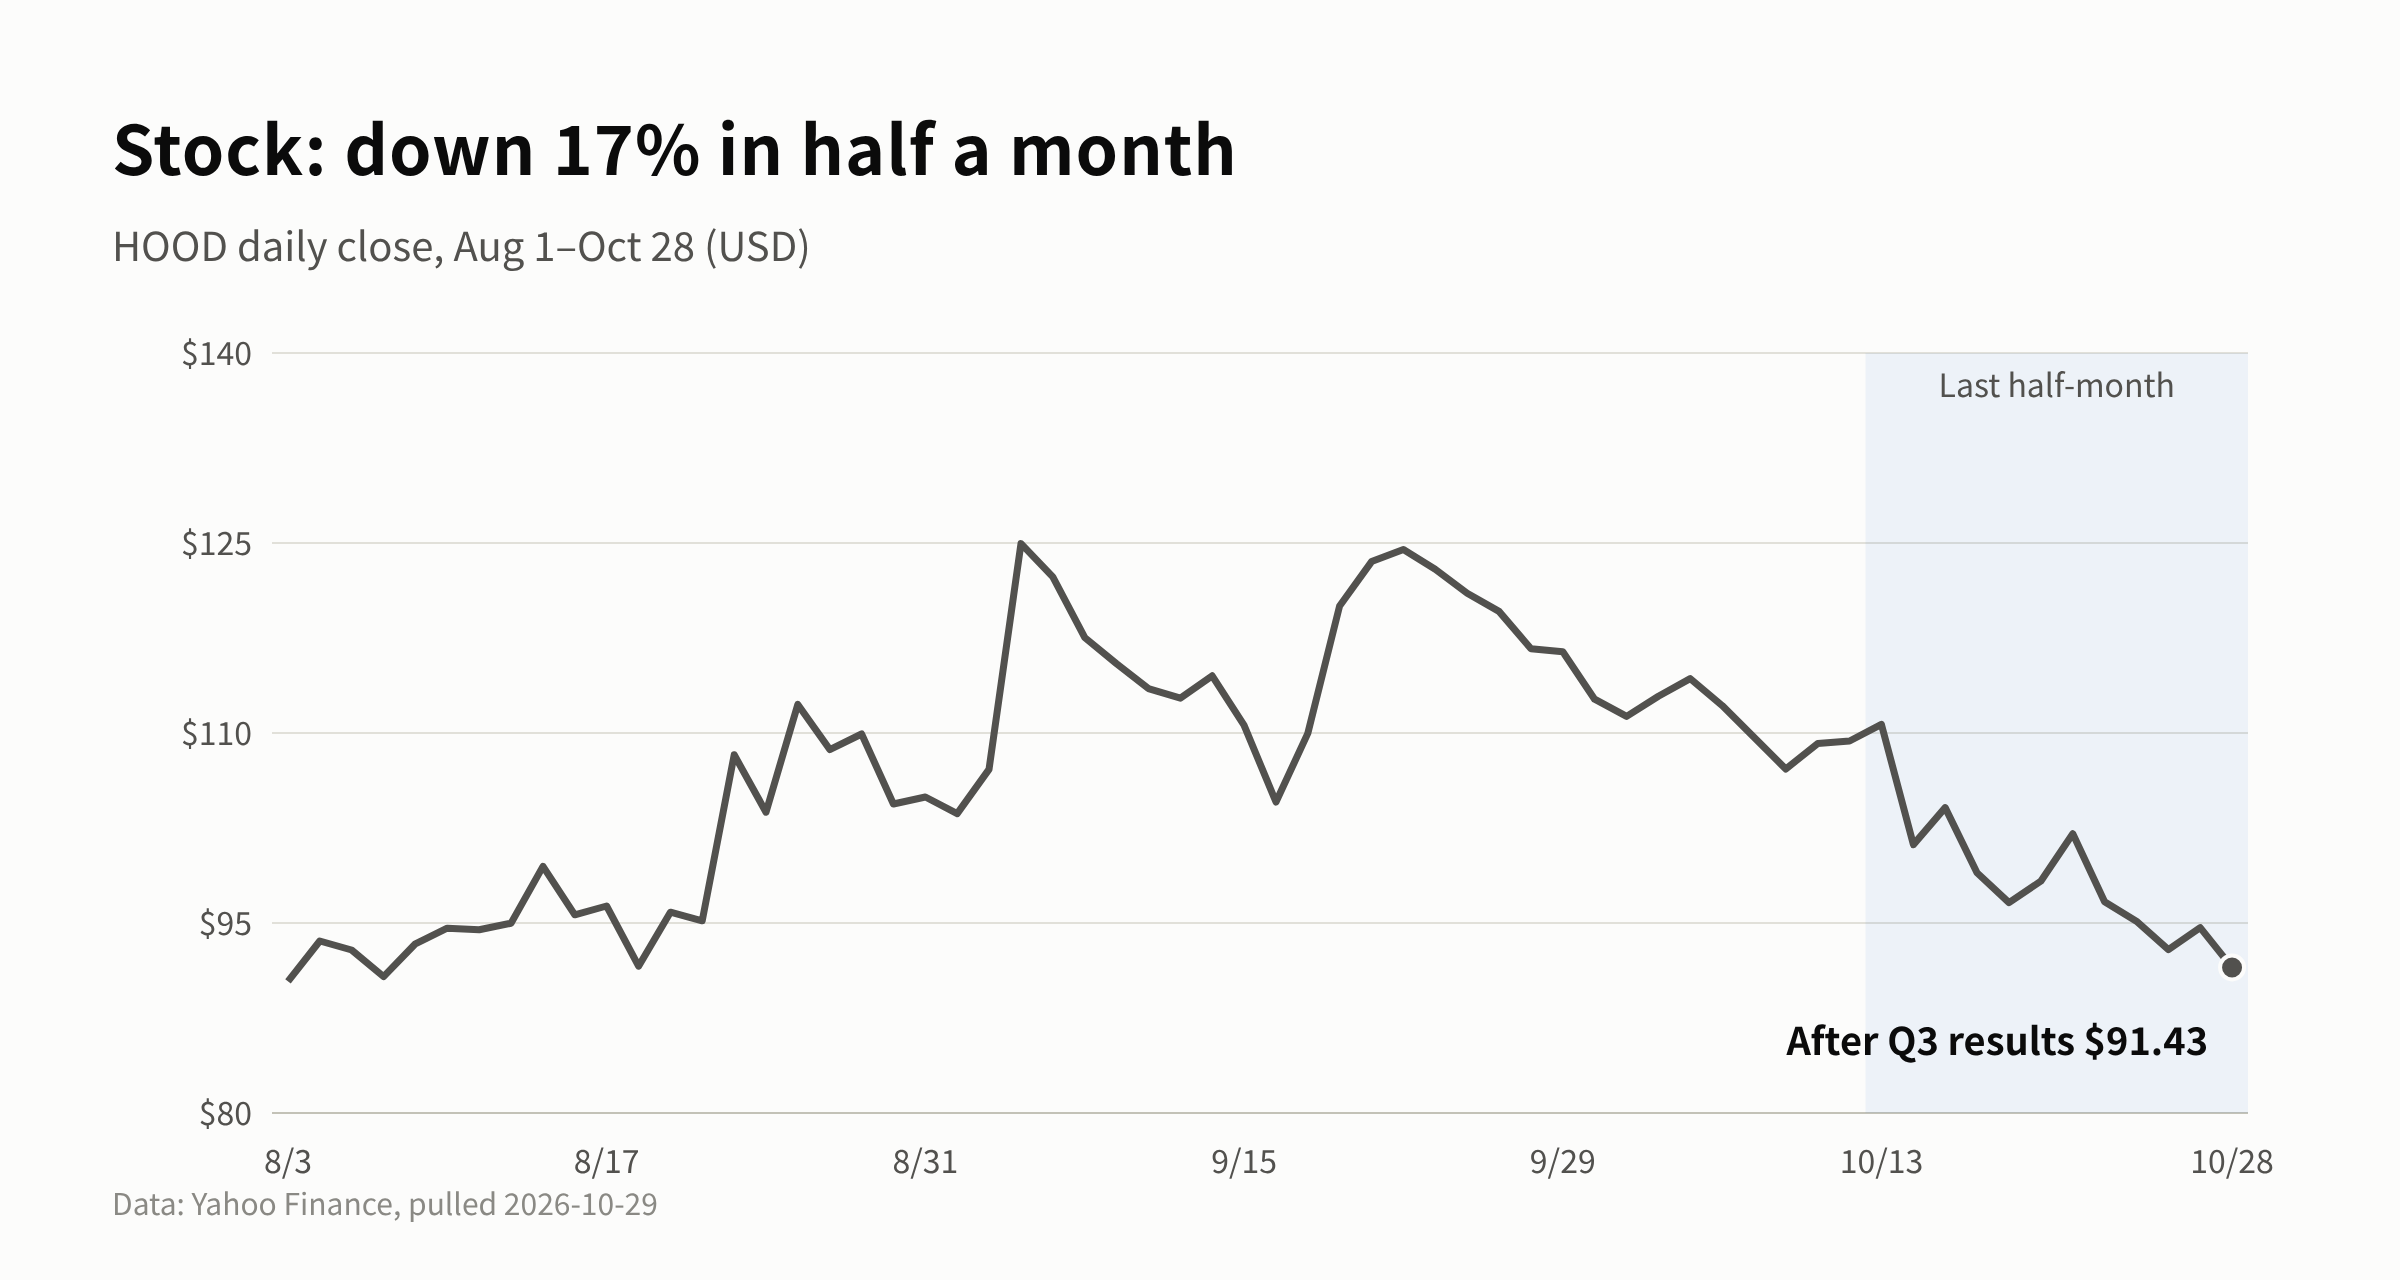
HOOD fell from $110.52 on Oct 13 to $91.43 on Oct 28, down 17.3%. It dropped another 7% or so after hours on results night. The immediate cause was a profit miss: diluted EPS of $0.51, down 16% year over year, against analyst expectations of $0.55–0.56.
Crypto is what dragged profit down, and the revenue mix shows it at a glance:
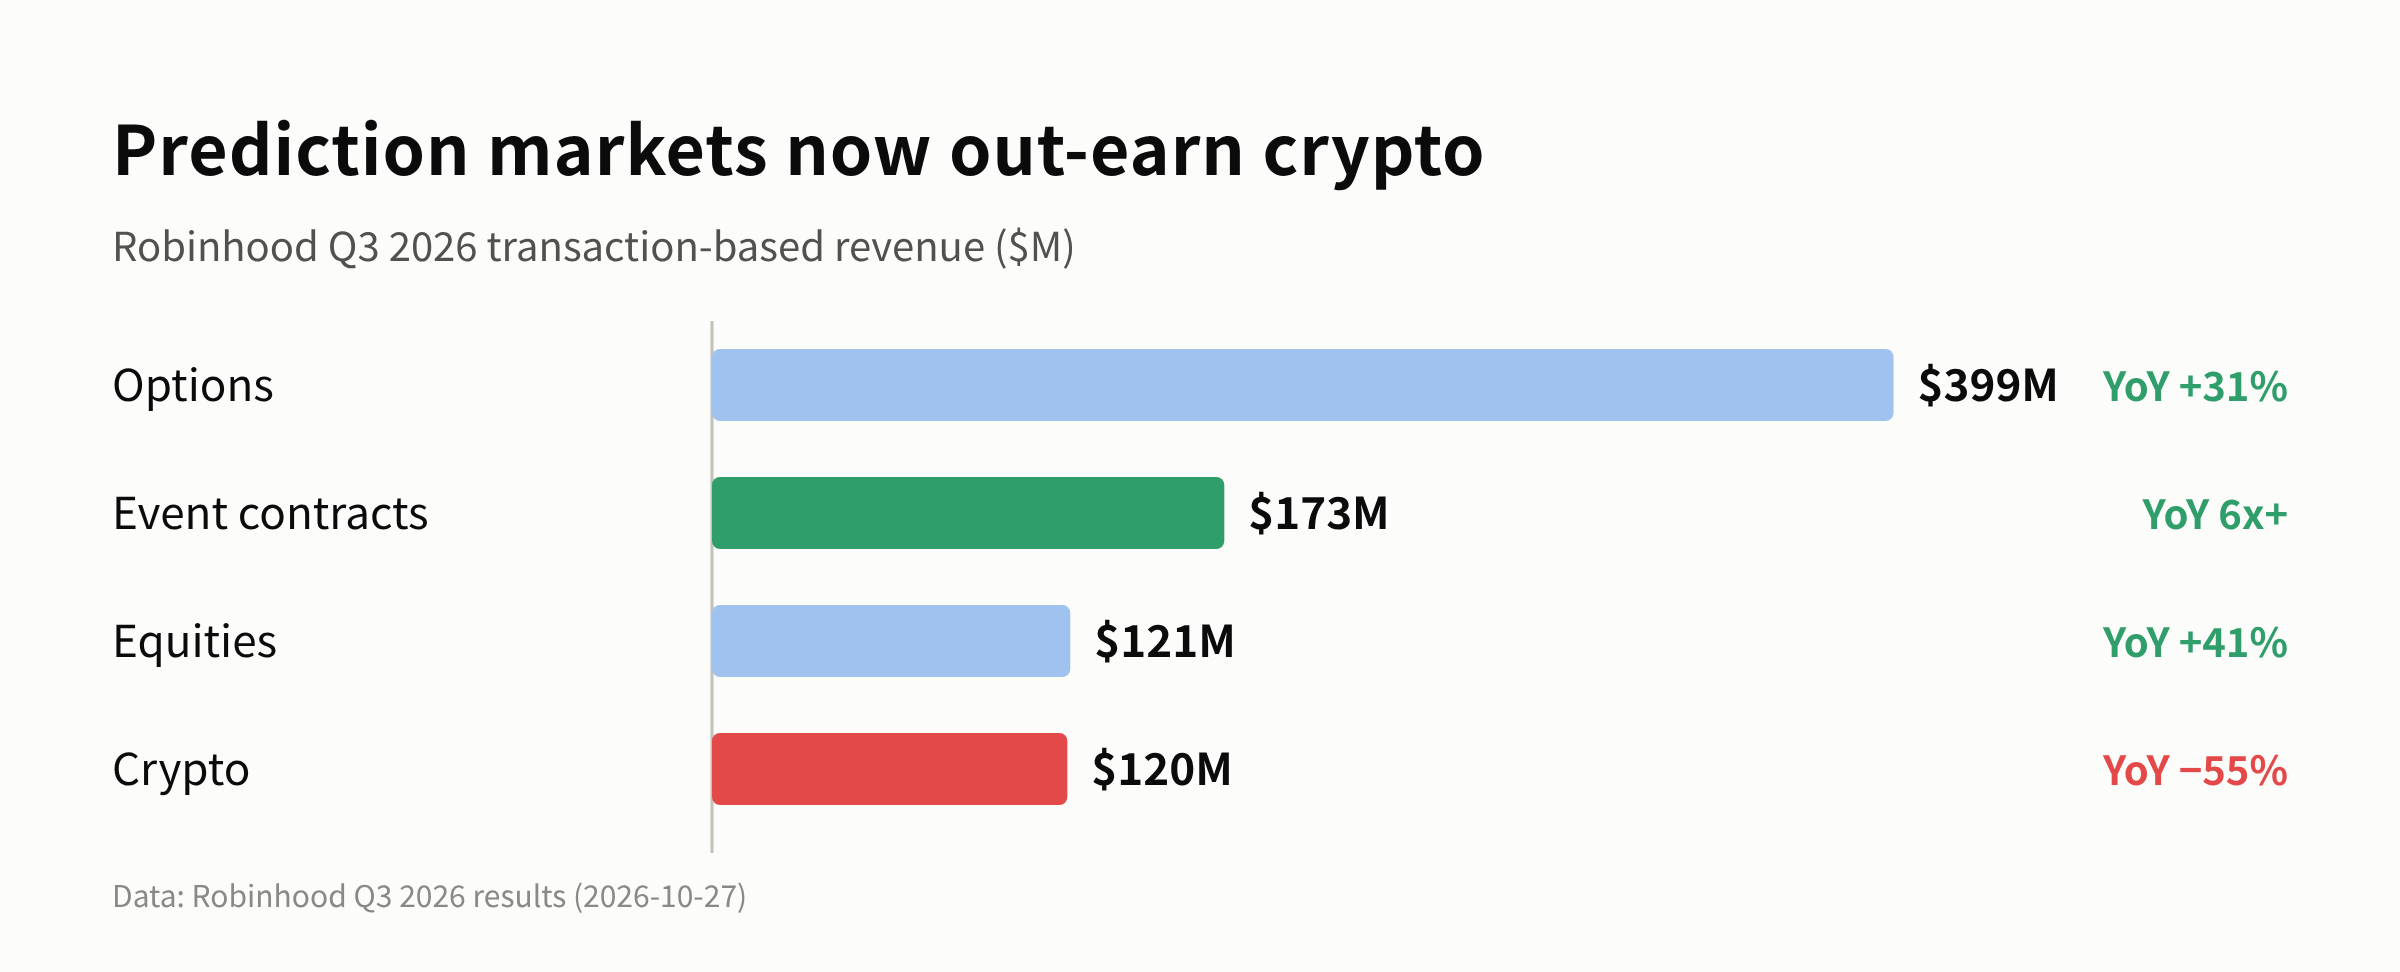
- Crypto revenue was $120M, down 55% year over year. Crypto notional volume was $50B, down 38%: the app was down 48% and Bitstamp down 28%.
- Event contracts, that is, prediction markets, brought in $173M, more than 6x a year earlier, and now out-earn crypto. The CFO put the business’s annualized revenue at close to $500M.
- Options were $399M (+31%) and equities $121M (+41%). Total revenue was a record $1.42B, up 12%.
Then deposits:
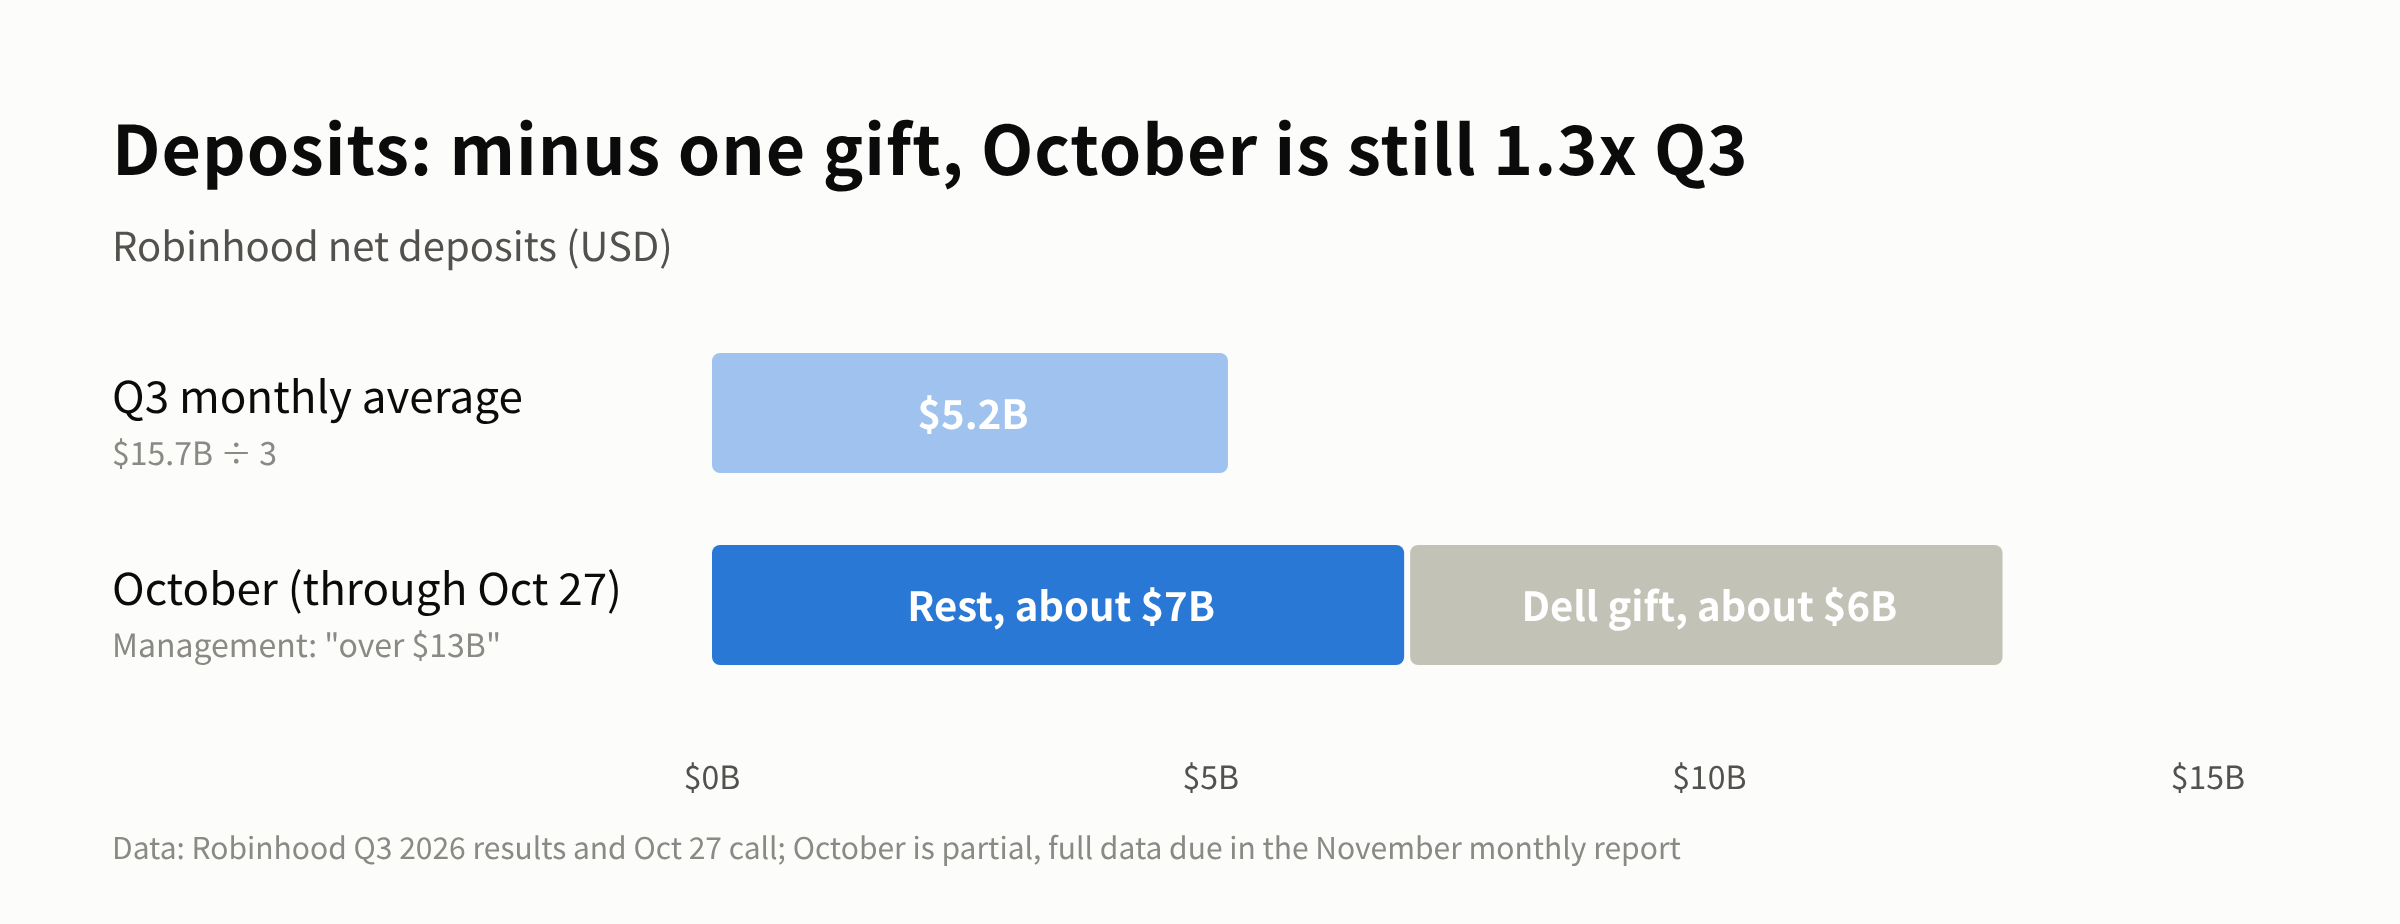
October net deposits are already over $13B, including about $6B from the Dell family’s gift to Trump Accounts. Take that out and roughly $7B remains, still 1.3x the Q3 monthly average of $5.2B. Year-to-date net deposits are over $68B, and total platform assets are $396B, up 19%.
Put the chain and the company side by side and it is one story from two angles: crypto trading is ebbing, and money is still flowing into the Robinhood system. Onchain TVL is at a record and app deposits are at a record, while onchain DEX volume and app crypto volume are both falling.
This drop in the stock reflects the crypto cycle and a profit miss, not Robinhood Chain itself. The chain is not yet its own revenue line in Robinhood’s results. For now, its value can only be read from onchain data.
7. What this means for you
If you are evaluating broker-built chains, these two weeks give a clear order to watch:
Money arrives first, market makers follow, trading comes back, revenue arrives last.
Robinhood Chain is now stuck between steps two and three. The market-making money is in; trading has not followed.
Two weeks of data can’t settle this. But it shows the difference between a chain with a parent company’s distribution and one that grew on speculation alone. Six weeks after the hype peaked, daily actives are down more than half, and the money on the chain is at a record. The capital that stayed is not here for short-term heat.
The scissors can’t stay open forever, though. Money that sits in pools waiting for volume that never comes will eventually leave. The next question is who replaces the departing meme traders. Candidates are already on the table. On Oct 27 Ripple announced a partnership with Robinhood: RLUSD will be used for institutional trade settlement and treasury operations, and it is already live on Robinhood Chain. Tokenized stocks are another answer, though there is no verifiable recent data on their size yet.
Three things to watch next
- The $41M in Uniswap V3: if it leaves first, market makers have run out of patience with volume.
- Onchain stablecoin supply after RLUSD: can it break out of its plateau around $1.1B?
- The October monthly report in mid-November: does app crypto volume keep weakening, and do event contracts keep growing?
How will the scissors close? Will flow catch up, or will stock fall back? Which way are you leaning?
#RobinhoodChain #OnchainData #PredictionMarkets
Sources and notes
- DeFi TVL, DEX volume, chain-wide fees and protocol TVL: DefiLlama (Robinhood Chain chain page, protocol pages and API), UTC daily, pulled 2026-10-29.
- Stablecoin supply: DefiLlama Stablecoins (Robinhood Chain).
- Transactions and daily active addresses: growthepie, pulled 2026-10-29. Daily actives had an anomalous spike in mid-August (over 5M in a day), so Figure 5 starts on Aug 20. This does not affect the conclusions.
- Windows: prior 7 days are Oct 14–20, last 7 days are Oct 22–28. TVL compares Oct 14 with Oct 28.
- “Fees per $10K of volume” is a rough ratio of chain-wide fees to DEX volume. Fees include non-DEX protocols, so read it as a trend only. DefiLlama backfilled some historical fee data this month, so mid-September values are higher than those cited in the last issue. Everything here is recomputed from data pulled on Oct 29.
- Steakhouse Financial is not listed in the protocol breakdown: it is a vault curator on Morpho, and its funds double-count Morpho’s.
- HOOD price: Yahoo Finance daily close. After-hours drop of about 7% and analyst estimates: Quartz, citing Reuters and CNBC.
- Q3 financials: Robinhood, “Robinhood Reports Third Quarter 2026 Results” (2026-10-27). October net deposits (over $13B, including a $6B Dell gift), year-to-date deposits and prediction markets’ ~$500M annualized revenue: Q3 earnings call (CFO Shiv Verma) and Reuters.
- RLUSD partnership: CNBC, 2026-10-27.
- Not covered: issuance and trading volume of tokenized stocks. Public data stops in July and definitions vary, so it is not used here.
转发此帖子?
与您的关注者分享。
回复