
Contents (6)

·
Three Questions for Any Subsidy: Robinhood Chain's gas subsidy was under 1% of its fees
Robinhood Chain's gas subsidy was under 1% of cumulative fees, reached 1-2% of transactions, and only covered gas above a $0.50 threshold. Two weeks after it expired, the chain is still standing and TVL is up 5%. Three questions to ask about any subsidy.
If you’re judging whether a new chain’s activity is real, or you’ve ever run a growth subsidy in your own product, this one is worth three minutes.
Robinhood Chain’s 90-day gas subsidy expired at 23:59 EST on September 29. The market consensus was that the chain had been propped up by subsidies, and would fall over the moment they stopped.
Two weeks later, it hasn’t. And you could have worked out why before the deadline.
Start with three numbers:
- Cumulative protocol fees on the chain since launch: $694.4M (DefiLlama, Sep 28).
- Total cost of the 90-day subsidy, by my estimate: $300K–$3M.
- That’s 0.04%–0.43% of fees. Even on the most generous assumption ($6M), it’s 0.86%.
The most the expiry could remove was about 1% of the chain’s fee base.
For scale: Robinhood’s net sequencer revenue in August alone was roughly $6M. One month of income covered more than the whole 90-day subsidy.
Three questions for any subsidy
To judge how much activity a subsidy is actually holding up, you only need to ask three things. They work for Base, Blast, Monad, or any chain paying out incentives.
1. Which layer does it pay for?
This chain has four kinds of fees, and they behave differently:
| Fee | Who gets paid | Subsidized? |
|---|---|---|
| L2 network gas (paid in ETH) | Sequencer → ~81–90% to Robinhood, 10% of net protocol revenue to Arbitrum | ✅ Only this one |
| Application fees (Uniswap swaps, Pons launches, GMGN) | Protocols and LPs | ❌ Never |
| L1 settlement (blobs + proofs) | Ethereum | ❌ Robinhood pays; ~$49K total since Apr 30 |
| 0.10% FX fee | Robinhood | ❌ Brokerage side, not the chain |
Close to 90% of fees are generated at the application layer, and the application layer was never subsidized for a single day.
2. How many users does it reach?
Robinhood Wallet accounts for less than 1–2% of transactions on the chain. Ark’s Lorenzo put it more bluntly: “Confirmed Robinhood Wallet activity is under 1% of transactions. It’s basically the same degens on a new chain.”
The subsidy reached 1% of users. The market was worried about 100%.
3. Full or excess?
This is the least discussed question and the most important one. It was an excess subsidy, not a free ride.
Robinhood originally covered only the portion of any single transaction’s gas above $5, later lowered to $0.50. Below that threshold, users paid in full and the subsidy paid nothing.
Median gas per transaction on September 16 was $0.026. Nowhere near the threshold.
The collapse already happened once, with the subsidy still running
This is the autopsy.
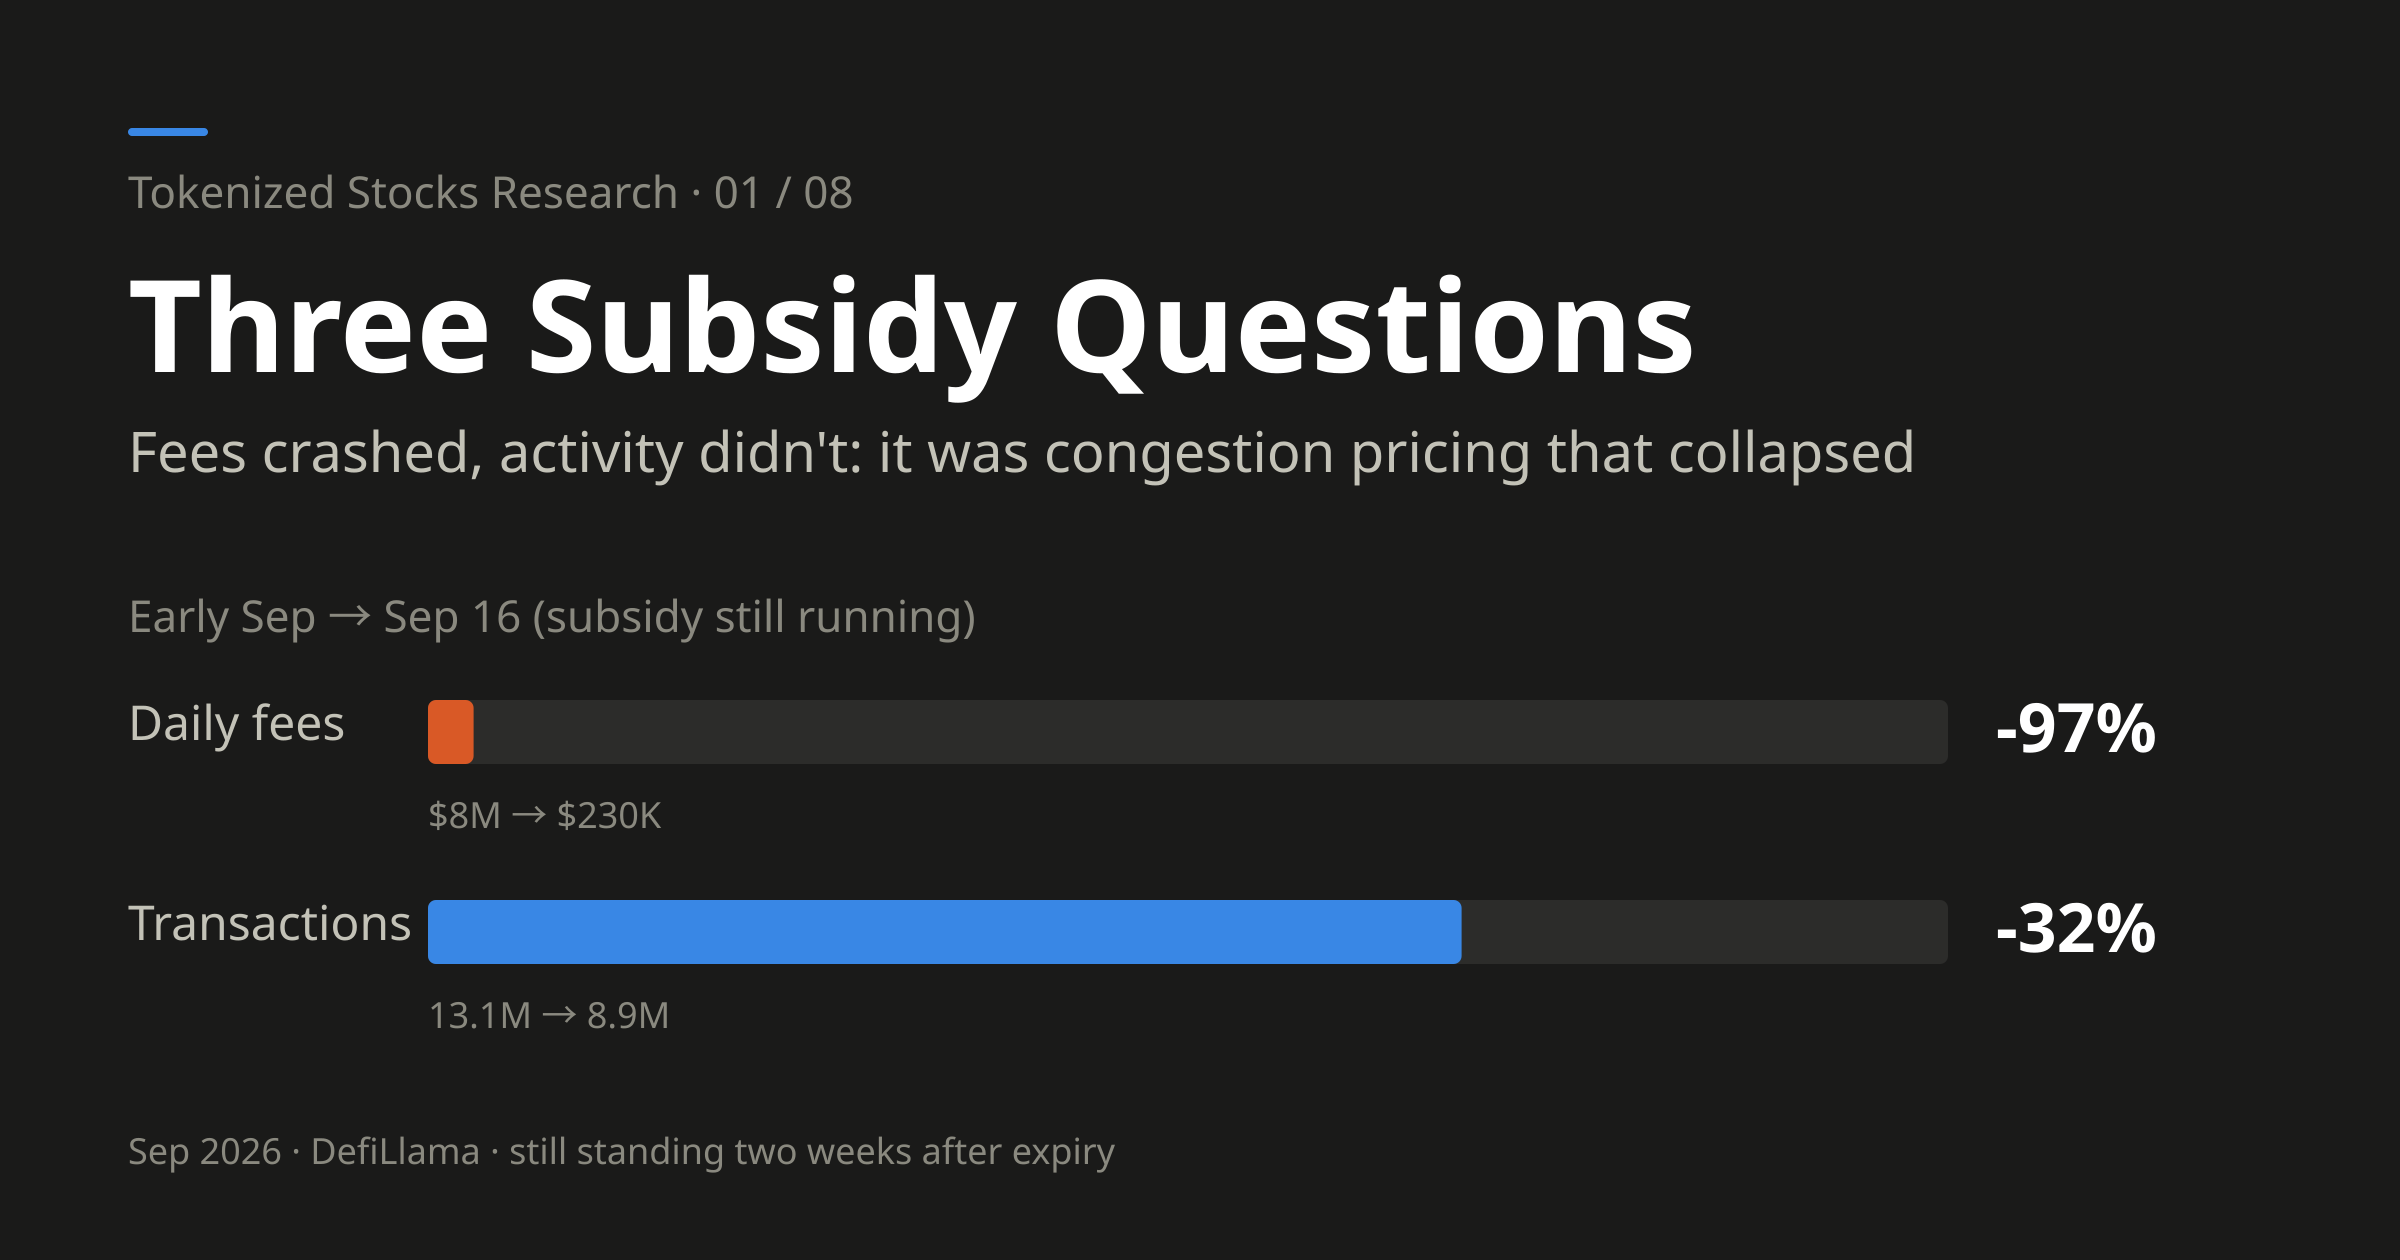
Between early September and September 16, daily network fees fell from about $8M to about $230K, down 97%. People panicked.
Over the same stretch:
- Transactions fell from 13.1M to 8.9M, down only 32%
- On a 7-day average: fees down 82%, transactions down just 6%
- DEX volume actually rose 5%, to $12.8B
- Median fee per transaction went from $0.18 to $0.06; the peak-day average went from $0.64 to $0.026
That wasn’t an activity collapse. It was a congestion-pricing collapse. The chain runs a shared fee market, so when one app gets congested, gas rises for everyone. When Pons was launching 25,000 tokens a day, it pushed everyone’s gas to 64 cents a transaction. When Pons cooled off, gas fell back to 2.6 cents.
The subsidy was still being paid in full. Fees fell 97% anyway.
So the variable driving this chain’s fees was never gas policy. It was the memecoin cycle.
Two weeks after expiry: still standing, but cooling
Comparing the week before expiry (Sep 23–29) with the second week after (Oct 6–12):
| Metric | Week before | Second week after | Change |
|---|---|---|---|
| Daily transactions | 7.68M | 5.85M | -24% |
| Weekly DEX volume | $9.4B | $6.3B | -34% |
| Daily chain-level gas fees | $139K | $50K | -64% |
| TVL | $1.01B | $1.06B | +5% |
(Transactions: L2BEAT. Everything else: DefiLlama.)
Activity is cooling. No point pretending otherwise. But two things say the expiry didn’t cause it.
First, the cooling started before the deadline. Daily transactions had been falling since September 15, when they hit 11.38M; by the week before expiry they averaged 7.68M. The decline after expiry is the same curve, continued.
Second, at the moment it expired, the subsidy was paying out almost nothing. After expiry, average gas per transaction was about $0.0085 ($50K ÷ 5.85M), nearly 60 times below the $0.50 threshold. Below the threshold, users were already paying in full. For nearly every transaction, the cost was the same before and after.
Meanwhile the one number that measures stock rather than flow, TVL, went up 5%.
The chain didn’t fall over. What’s cooling is a curve that started before the subsidy ended.
What to watch instead
There are three subsidies on this chain, and gas is the smallest:
| Subsidy | Size | Status |
|---|---|---|
| 1. Robinhood gas subsidy | $300K–$3M | Expired Sep 29 |
| 2. Lighter’s LIT incentives | ~$11M, double points for Wallet trades | Ongoing |
| 3. Robinhood Earn at ~7% APY | Pulled in $456M of USDG deposits, at one point 68% of chain TVL | Rate cuts announced |
The second is an order of magnitude bigger than the first. The third decides whether the TVL stays. And everyone was watching the first.
(Also worth noting: Ethena seeded Steakhouse’s USDG vault with about $50M.)
The flip side, and it’s bad news
If the gas subsidy didn’t hold up activity, and Wallet users are only 1–2% of transactions, then the conclusion runs the other way too:
The chain’s boom so far has had nothing to do with distribution through Robinhood’s main app.
That’s not the same as “nothing to do with Robinhood.” The $456M that Earn pulled in is itself Robinhood’s ability to organize capital. What’s been ruled out is the 28.6M retail accounts as an entry point, not Robinhood’s distribution as a whole.
Formo’s data backs this up: only 1.7% of new addresses on the chain have any DeFi history, against a 20.6% baseline for mature protocols. CoinDesk Research put it most carefully, and most damningly: “All of these metrics were produced with the funnel closed.”
So it cuts both ways:
- The good news: activity wasn’t bought, and there was never a reason to expect the chain to collapse just because the subsidy ended.
- The bad news: the real moat, 28.6M funded accounts, has not been switched on through the retail entry point even once. The current boom can’t be used as evidence for the core bull case that Robinhood’s distribution advantage is paying off.
A closed moat and a moat that doesn’t exist look identical in today’s data. The only way to tell them apart is to wait for main-app integration.
Three lines to close
This chain was never held up by its subsidy: under 1% of cumulative fees, under 2% of transactions, only the portion above the threshold, and it expired when gas per transaction had already fallen from $0.64 to $0.026.
To judge any chain’s subsidy, ask three things first: which layer, how many users, full or excess.
The question worth asking about this chain isn’t “will it collapse without the subsidy.” It’s “when do the 28.6M accounts show up.”
If you’ve run a growth subsidy: which layer were you paying for, and what share of real users did it reach?
Repost this post?
Share with your followers.
Reply