
Contents (6)

·
60% of a 6.56% Onchain Yield Is Someone Else's Gift: One Equation to Find Who Pays
Sixty yield-bearing pools on Robinhood Chain average 6.56%, and 60.1% of that is rewards. This piece splits onchain yields into six parts (price, fees, lending spread, basis, subsidies, risk compensation) to find who pays each one, sets a 3.5–4% unsubsidized benchmark, and shows how bridging, slippage, weekend premiums and regional access change what you actually earn.
If you are comparing onchain yields, picking a place to park dollars for yourself or for clients, this piece gives you one tool: every return can be split into six parts, and each part has a specific payer. Find the payer and you know how long the return can last.
Start with a number. In late October 2026, DefiLlama tracked 60 pools on Robinhood Chain with a positive yield, holding about $970 million in total. The TVL-weighted average yield was 6.56%. That beats Treasuries and most bank savings.
But 60.1% of it was rewards. In 35 of the 60 pools, more than half the yield came from rewards. Among the 52 small pools under $1 million, the median yield was 64%, almost all of it rewards. Merkl, the main incentive platform on this chain, was running 30 campaigns on November 2 and paying out about $100,000 a day.
Subsidies are not bad in themselves. A new chain needs them to bootstrap liquidity, the way a new mall subsidizes its first tenants. The problem is that investors treat the subsidy as the return and forget to ask: who pays it, and until when?
The Yield Equation: Six Sources, Six Payers
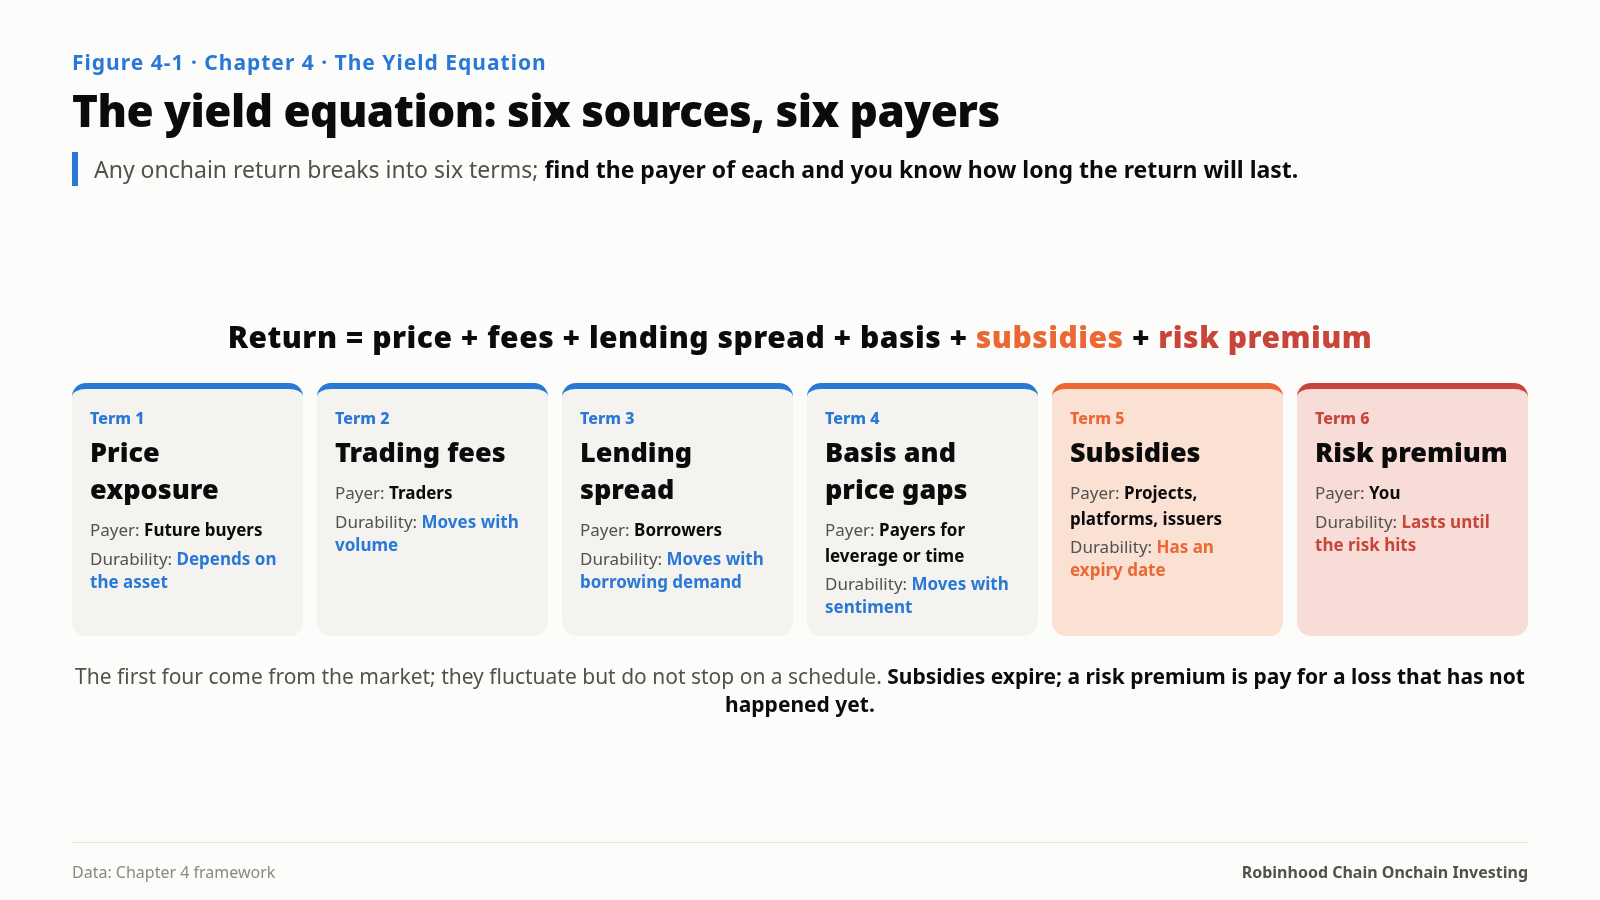
Return = price exposure + trading fees + lending spread + basis and price gaps + subsidies + risk compensation
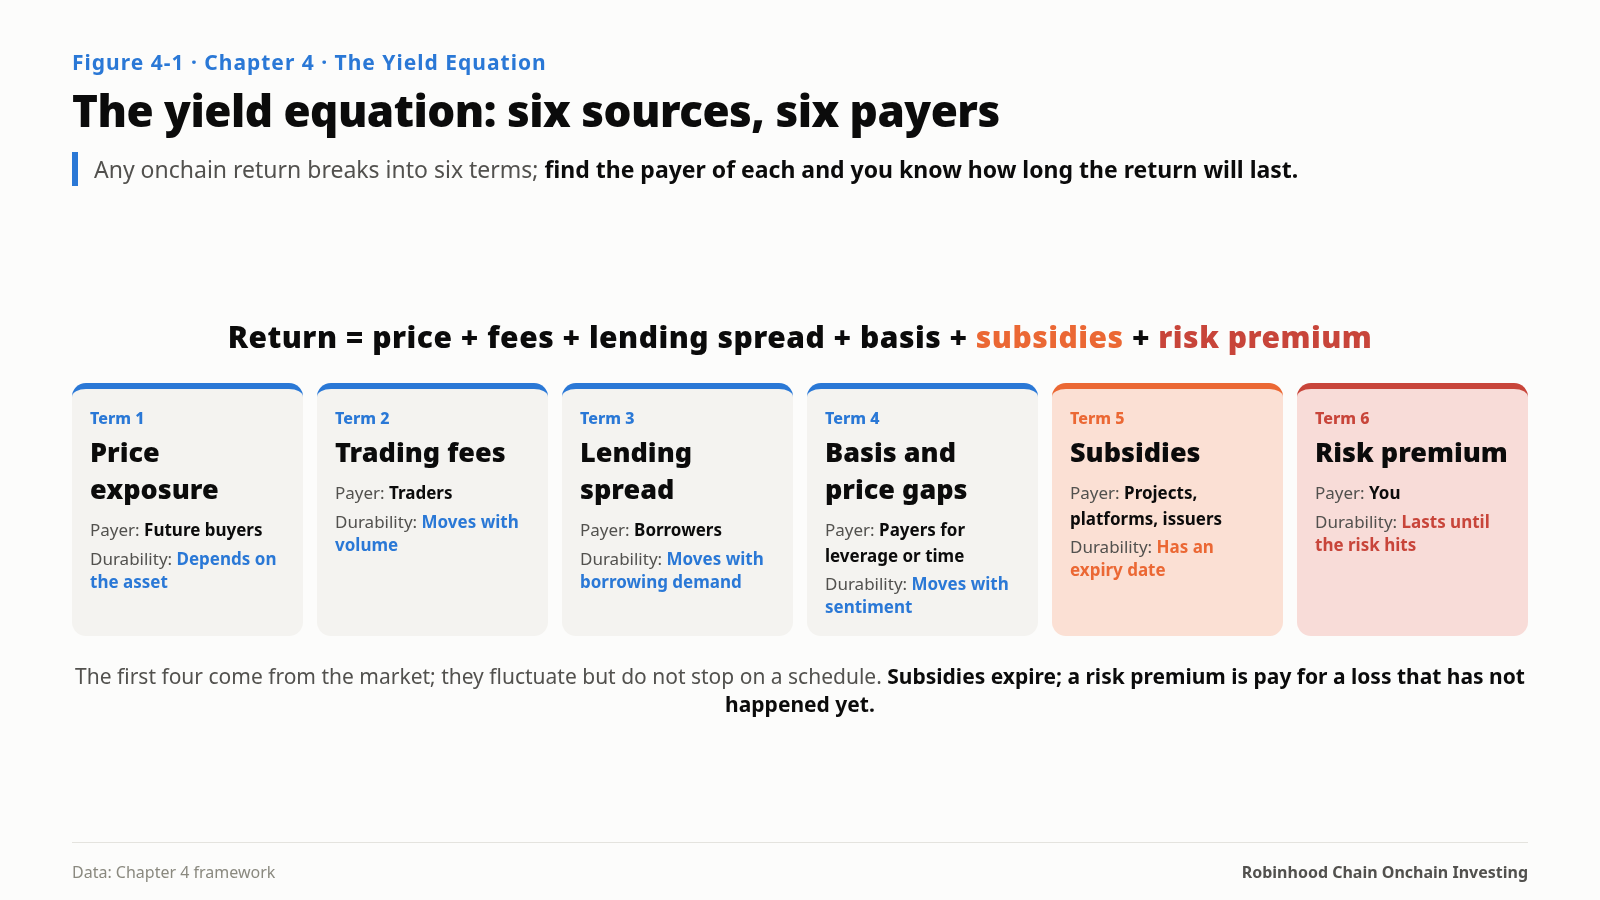
Each part has a payer:
- Price exposure: future buyers, and the asset’s fundamentals.
- Trading fees: traders; varies with volume.
- Lending spread: borrowers; varies with borrowing demand.
- Basis and price gaps: people willing to pay for leverage or time, such as longs paying funding or weekend buyers paying a premium.
- Subsidies: a project, platform or issuer. They have an end date.
- Risk compensation: you. You are being paid to bear a loss that has not happened yet.
The first four come from the market. As long as people trade, borrow and use leverage, someone pays; these fluctuate but do not stop on a schedule. Subsidies have an end date. Risk compensation looks like income but is really an insurance policy you have sold and that has not yet come due.
Splitting Earn’s 7%
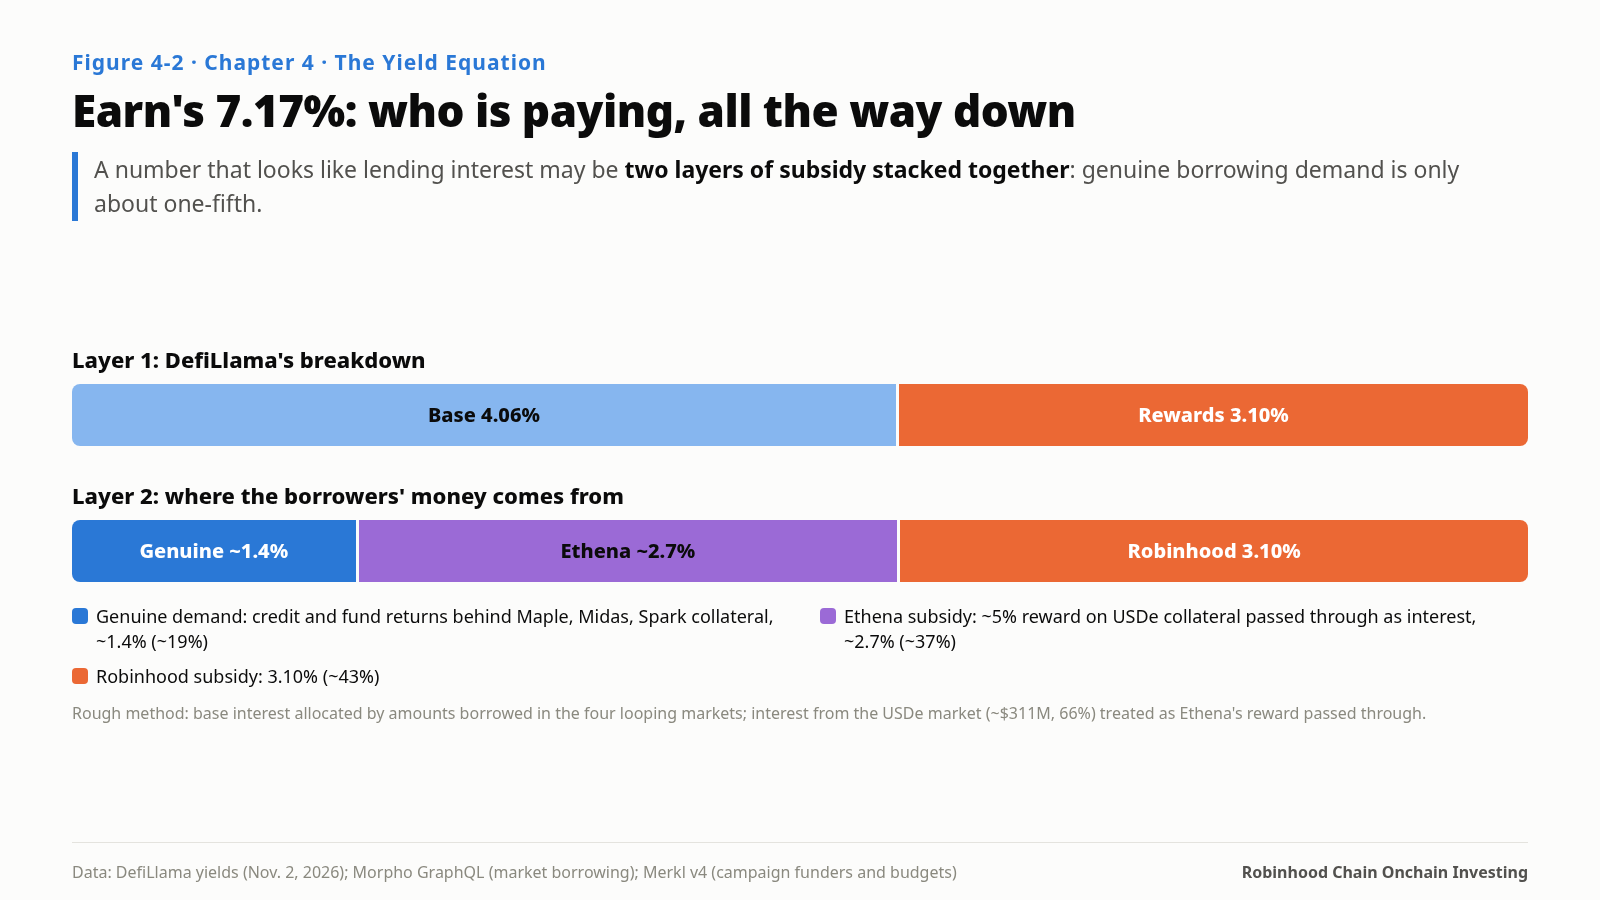
Robinhood Earn advertises about 7% to U.S. users. On November 2, the Steakhouse USDG vault behind it read 7.17%: 4.06% base interest and 3.10% rewards.
The rewards are easy to classify. They come from a Merkl campaign called “[Robinhood Users Only],” with a $115 million budget valid until July 1, 2027. Robinhood pays. That is a subsidy.
The base interest looks like a lending spread: the vault lends USDG and borrowers pay interest. Go one step further: where does the borrowers’ money come from? The vault’s largest allocation, about $311 million, is lent to people posting USDe as collateral. The USDe on this chain does not earn interest by itself. Borrowers are willing to pay about 4.4% to borrow USDG because Ethena pays an extra reward of about 5% on that market’s collateral. Borrowers pass most of that reward on to depositors as interest.
Split all the way down, about 43% of the 7.17% is Robinhood’s subsidy, about 37% is Ethena’s, and only about a fifth comes from real borrowing demand. The next piece in this series traces that flow in full. For now, remember what the equation shows: a number that looks like lending interest can be two layers of subsidy stacked together.
Splitting Other Products
The same knife on the chain’s main yield products (early November):
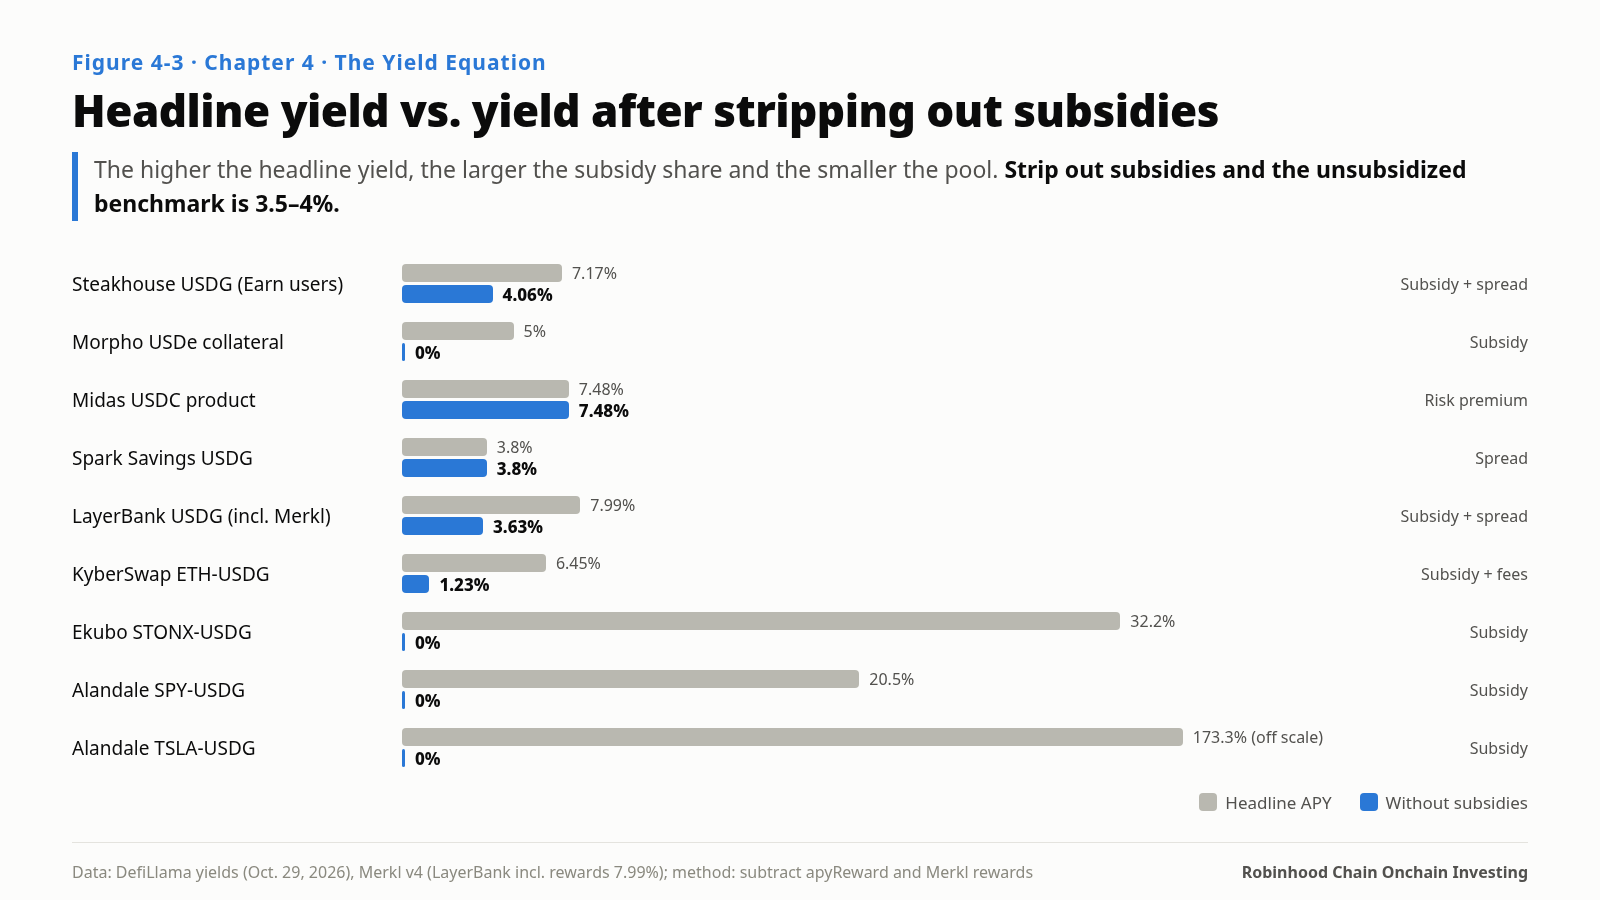
- Spark Savings USDG, 3.8%: the savings rate from the Sky ecosystem, no Merkl rewards, a lending spread. One of the few numbers here you can use as an unsubsidized benchmark.
- Midas’s USDC yield product, 7.48% (30-day average 6.46%): fund returns, no subsidy, but you carry the fund’s investment and redemption risk. Risk compensation.
- Morpho markets with stock tokens as collateral, 18–26% to suppliers: borrowers really do pay 21–29% to borrow dollars against NVDA, GOOGL and AAPL tokens. The demand is real, but each market holds only $200,000 to $700,000, and one deposit can push the rate down.
- Uniswap V4 stock-against-stock pools, 6–76% nominal: fees plus UNI rewards of a few hundred dollars a day per pool.
- Triple-digit yields in tiny pools: about 404% in Ekubo’s ETH/USDG pool, about 173% in Alandale’s TSLA/USDG pool, a few tens of thousands of dollars each, 100% rewards.
- Lighter perpetual funding, 3.4–7.6% a year paid by longs: shorts collect it. The payers are traders paying for leveraged long stock exposure.
Three Corollaries
Subsidy share runs inversely to size. The subsidy total is fixed, so the smaller the pool, the more each dollar gets. The moment you enter, you dilute it. Treat a small pool’s high yield as a one-time bonus; it does not scale with your money.
The unsubsidized benchmark on this chain is 3.5–4%. Spark’s 3.8%, the Steakhouse vault’s roughly 4% without Robinhood’s reward, and Lighter’s funding floor around 3.5% are three independent numbers in the same range. Every point above that range is either a subsidy or risk compensation, and you should be able to name who pays it.
Every subsidy tapers; the only question is how fast. That is the subject of a later piece on the subsidy half-life.
Don’t Forget the Cost of Getting In and Out
Yields are annual; entry and exit costs are one-time. Divide one by the other and you get a more useful number: the payback period.
Gas on Robinhood Chain is nearly free: a base fee around 0.02 gwei puts a swap under one cent, and swaps in Robinhood Wallet are gas-free until December 31. The real costs are bridging, slippage and price gaps:
- Bridging: Relay moves $1,000 to $100,000 from Base, Ethereum or Arbitrum into USDG for about 6 basis points. It refuses single deposits above $500,000, and it does not touch stock tokens.
- Getting the asset: $100,000 of SPY perpetual costs under 1 basis point to take; the same amount of SPY spot token costs about 29; $100,000 of AAPL spot token moves the price more than 5%. Above a few hundred thousand dollars, almost only the perpetual order book can absorb a stock position.
- Price gaps: buying stock tokens on weekends costs 10–38 basis points more on average.
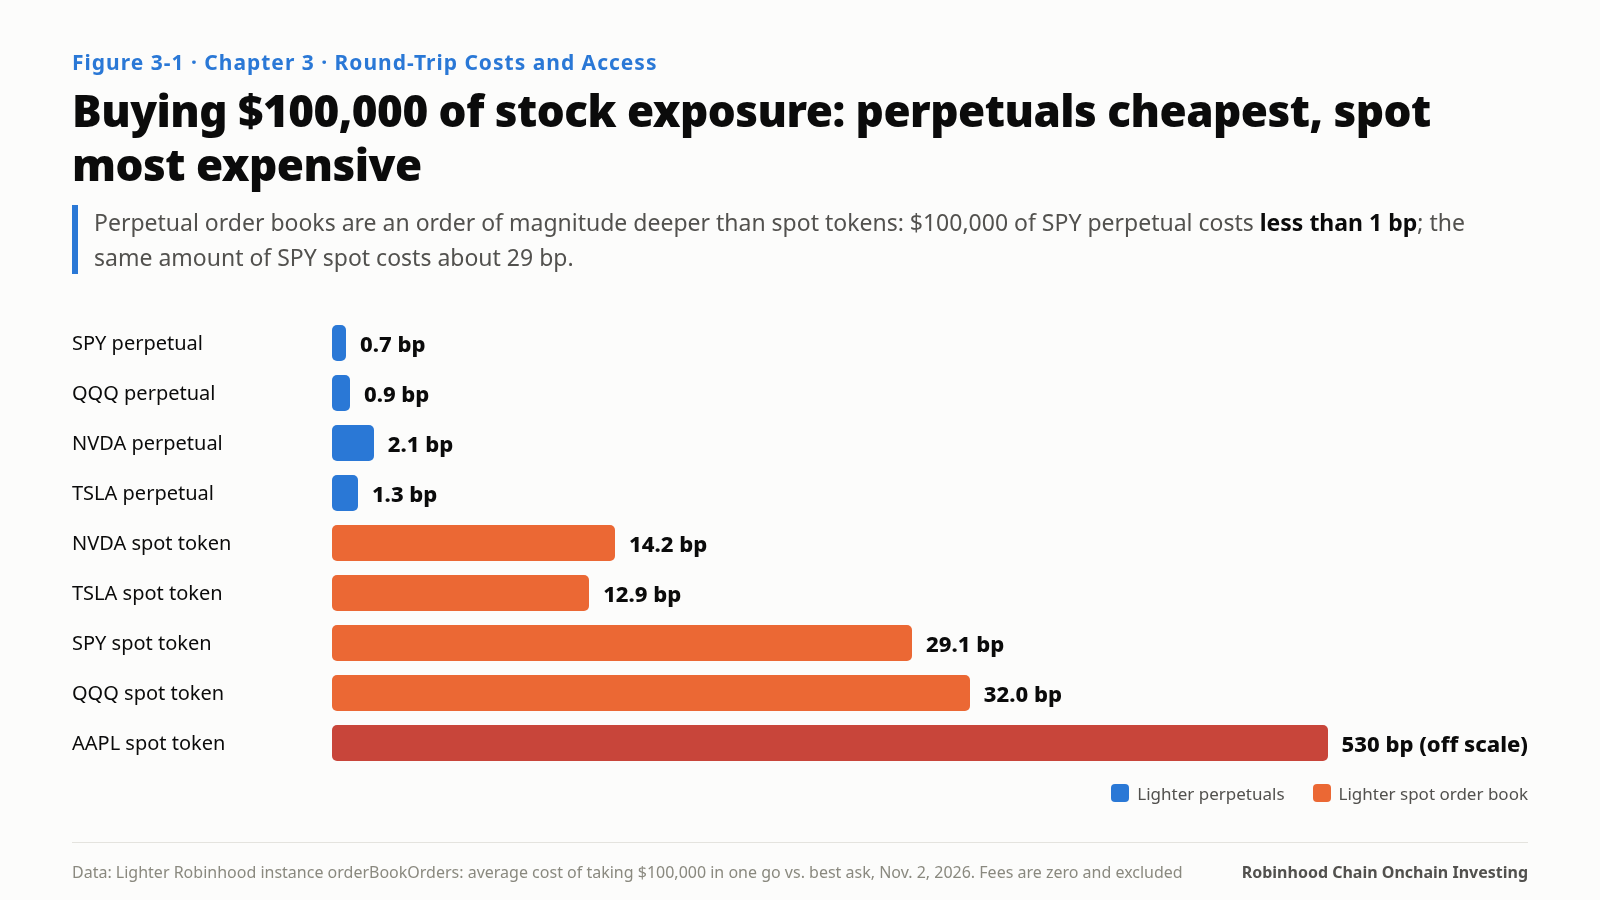
For $10,000 bridged in and out yourself: holding USDG for interest costs about 12 basis points round trip, paid back in about 11 days at 4%. Buying SPY spot tokens on a DEX costs about 80 basis points round trip, roughly a month of SPY’s long-run average gain.
One more cost can’t be computed, only checked: access. Earn is open only to eligible U.S. users (excluding New York and Texas), and the 3% reward is paid only through it. Stock tokens are open to international users in about 120 countries, and U.S. users may not hold them under the terms. In the same vault, a U.S. user earns 7% and an international user depositing directly earns about 4%.
If You Are Comparing Yields
- Split every yield into the six parts. Whatever you cannot split, treat as subsidy or risk compensation.
- Use 3.5–4% as the baseline. Name the payer for everything above it.
- Put subsidy end dates on your calendar. Every Merkl campaign’s dates are public.
- Check access before yield, and filter strategies by payback period. A subsidy you can’t receive is irrelevant; a strategy whose payback is longer than your holding period doesn’t work.
There is no free yield onchain, only payers you haven’t found yet. Find them and you know when the yield ends.
Who is paying the yield you hold right now?
—Adapted from Where the Yield Comes From: An Investor’s Handbook for Robinhood Chain, Chapter 3, “Round-Trip Costs and Access,” and Chapter 4, “The Yield Equation”
The full book (15 chapters, 42 figures): https://pickful.ai/books/dgpy
Repost this post?
Share with your followers.
Reply