
目录(7 节)

·
Onchain Stock Traders Are Almost All Long: Collecting on Leverage, and Sizing Lottery Positions
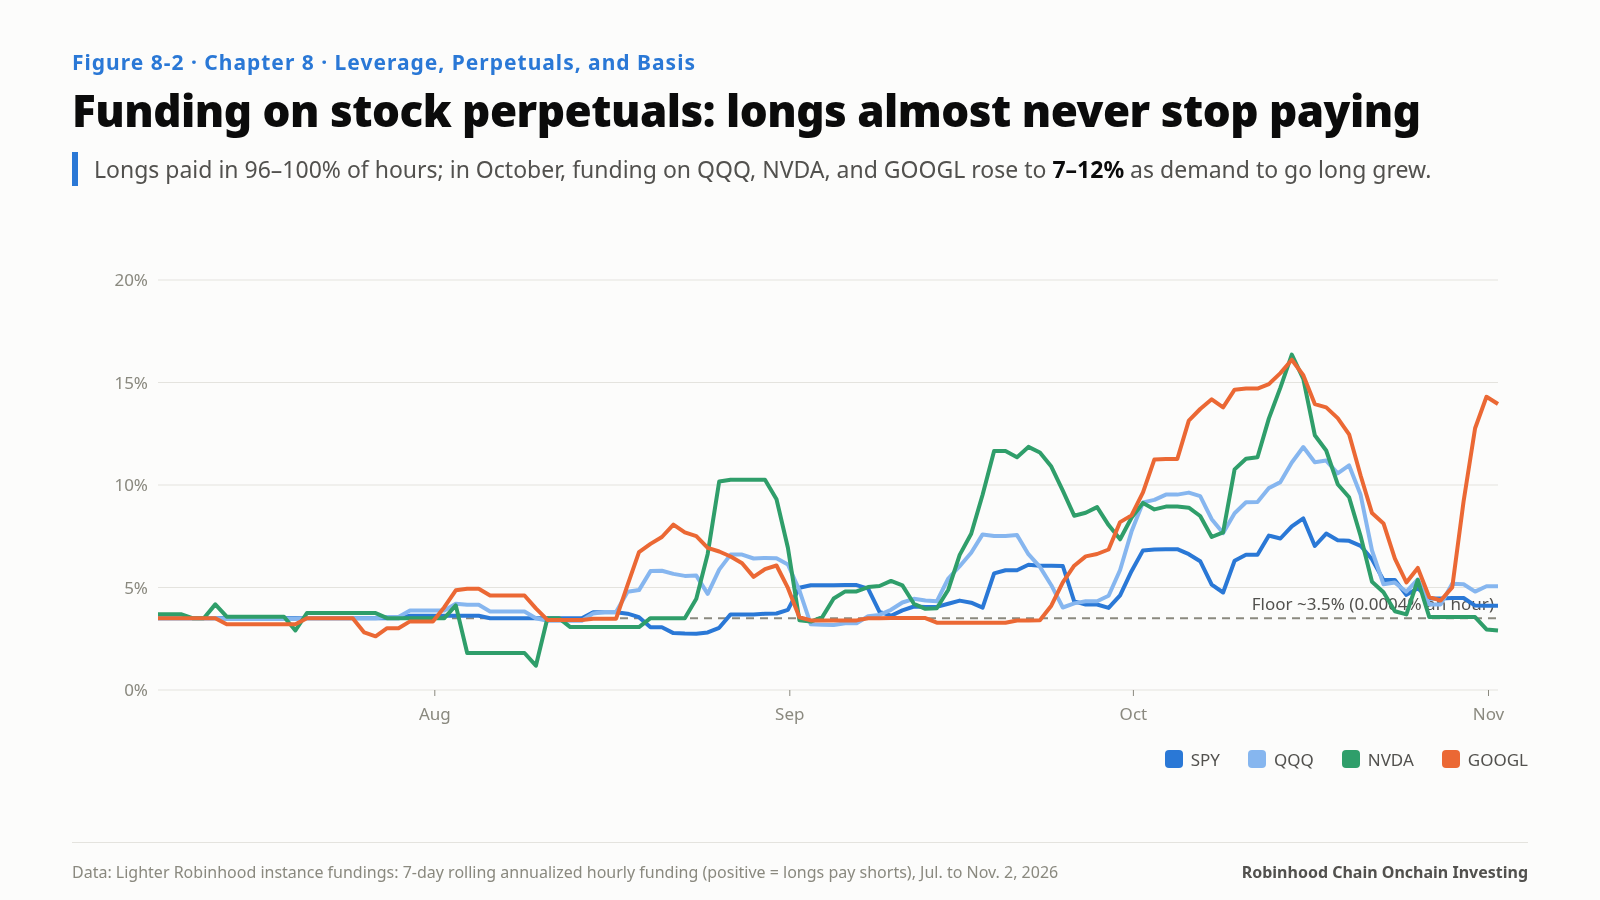
On Robinhood Chain, the same leverage costs over three times more in lending markets than in perpetuals, and stock-perpetual longs pay funding in 96–100% of hours. This piece prices the SPY basis trade (about 5.6% a year at October rates, with no subsidy) and its five risks, then uses survival rates, volume concentration and the Kelly criterion to size high-volatility new tokens.
If you want to use leverage to go long stocks on Robinhood Chain, or stand on the other side and collect what leverage costs, or you can’t resist buying a few freshly launched tokens, this piece gives you two calculations: how to compare the price of leverage, and how to size high-volatility positions.
The Same Leverage, Several Times the Price
Say you like NVIDIA, have $10,000, and want $20,000 of NVDA exposure at 2x. On this chain you have three routes:
- A long NVDA perpetual on Lighter: over the past 30 days, longs paid funding of about 7.3% a year.
- Post NVDA stock tokens on Morpho, borrow USDG, buy more: the borrowing rate in early November was about 23.5%.
- Buy an Arcus fixed-leverage token: the cost is perpetual funding plus rebalancing drag.
The second route costs more than three times the first. AAPL and GOOGL are the same story: lending-market rates of 21–29% against perpetual funding of 2.5–12%.
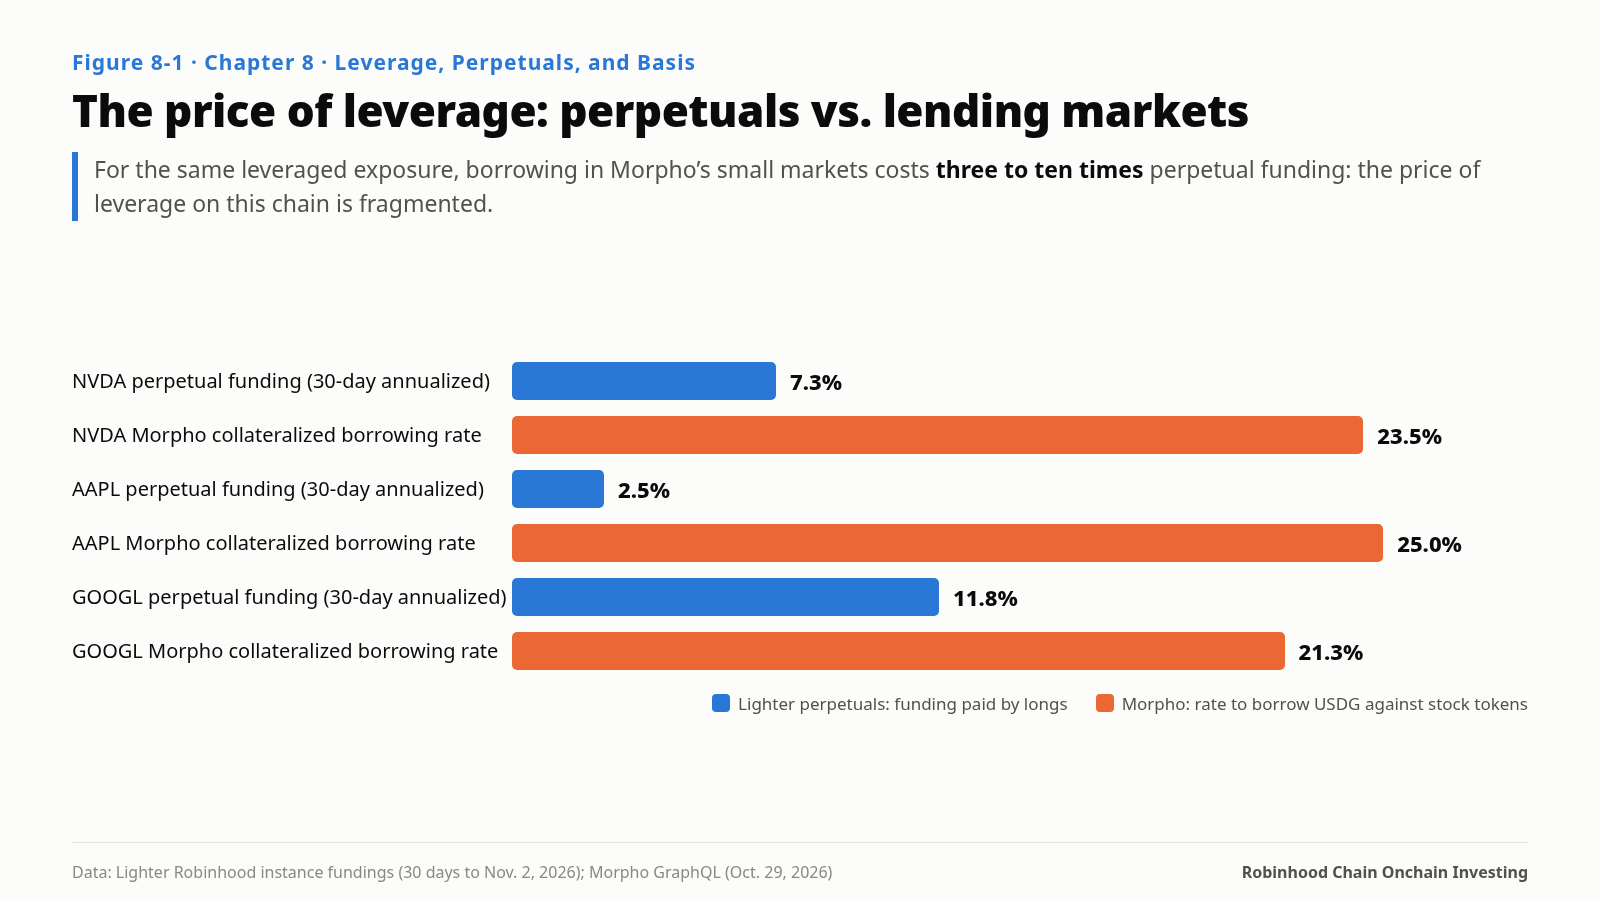
The reason is simple. Each Morpho market with stock-token collateral holds only $200,000 to $700,000; there are few lenders, utilization sits at 85–91%, and the rate curve is pushed high. Lighter’s perpetuals have $188 million of open interest and market-maker quotes, so supply and demand between longs and shorts set the price.
The price of leverage on this chain is fragmented. That is a trap for borrowers and an opportunity for anyone willing to lend dollars in those small markets.
The Most Active Stock Trading Isn’t in Stock Tokens
Lighter runs a separate instance on Robinhood Chain, and perpetual trading in Robinhood Wallet routes there. On November 2: 63 perpetual markets and about $616 million of 24-hour volume. The top market was the SPY perpetual at about $84.9 million; third was QQQ at about $67 million. Maker and taker fees are both zero. Funding settles every hour, weekends included.
A day of SPY perpetual volume is three to four times the combined daily volume of the main SPY spot-token pools. The most active stock trading on this chain is in stock perpetuals.
Longs Pay Almost Every Hour
I pulled every hourly funding payment for 15 major markets from June 30 to November 2, about 3,000 hours per market.
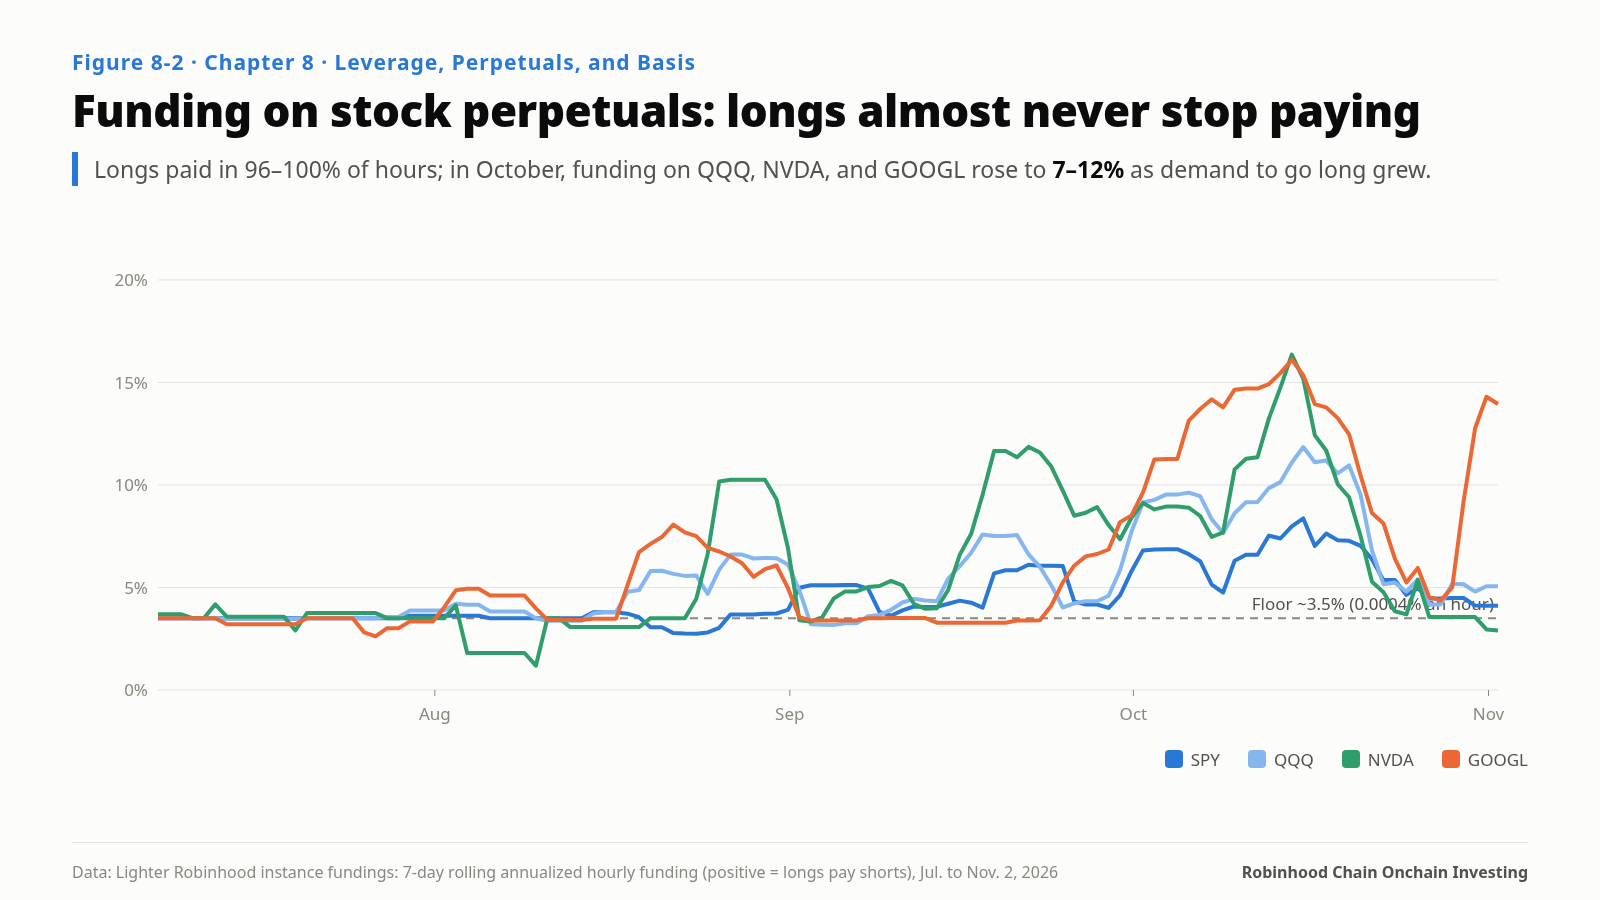
Three features:
- Longs almost never receive. In stock perpetuals, longs paid in 96–100% of hours. Onchain stock traders are almost all long.
- The floor is about 3.5%. Most markets rarely fall below 3.5% annualized, a built-in rate floor. It matches the 3.5–4% “unsubsidized dollar rate” I measured elsewhere on this chain.
- October rose sharply. QQQ, NVDA, GOOGL and TSLA rose to 7–12% in October: long demand is growing faster than short capital.
At early-November open interest and 30-day rates, longs in the top 15 markets pay shorts about $9 million a year.
The Basis Trade: Standing on the Other Side of Leverage
If longs keep paying, stand on the short side and collect, hedging price risk with spot: hold the stock token and short an equal amount of the perpetual. Price moves cancel; you earn funding.
At October readings, the SPY basis trade earns about 5.7% in funding plus about 0.7% in dividends via the multiplier, after the roughly 31% withholding. Capital required is the full token plus 10–20% perpetual margin. On total capital, that is about (5.7% + 0.7%) ÷ 1.15 ≈ 5.6% a year, or about 5.3% held for a year after 20–30 basis points of round-trip cost.
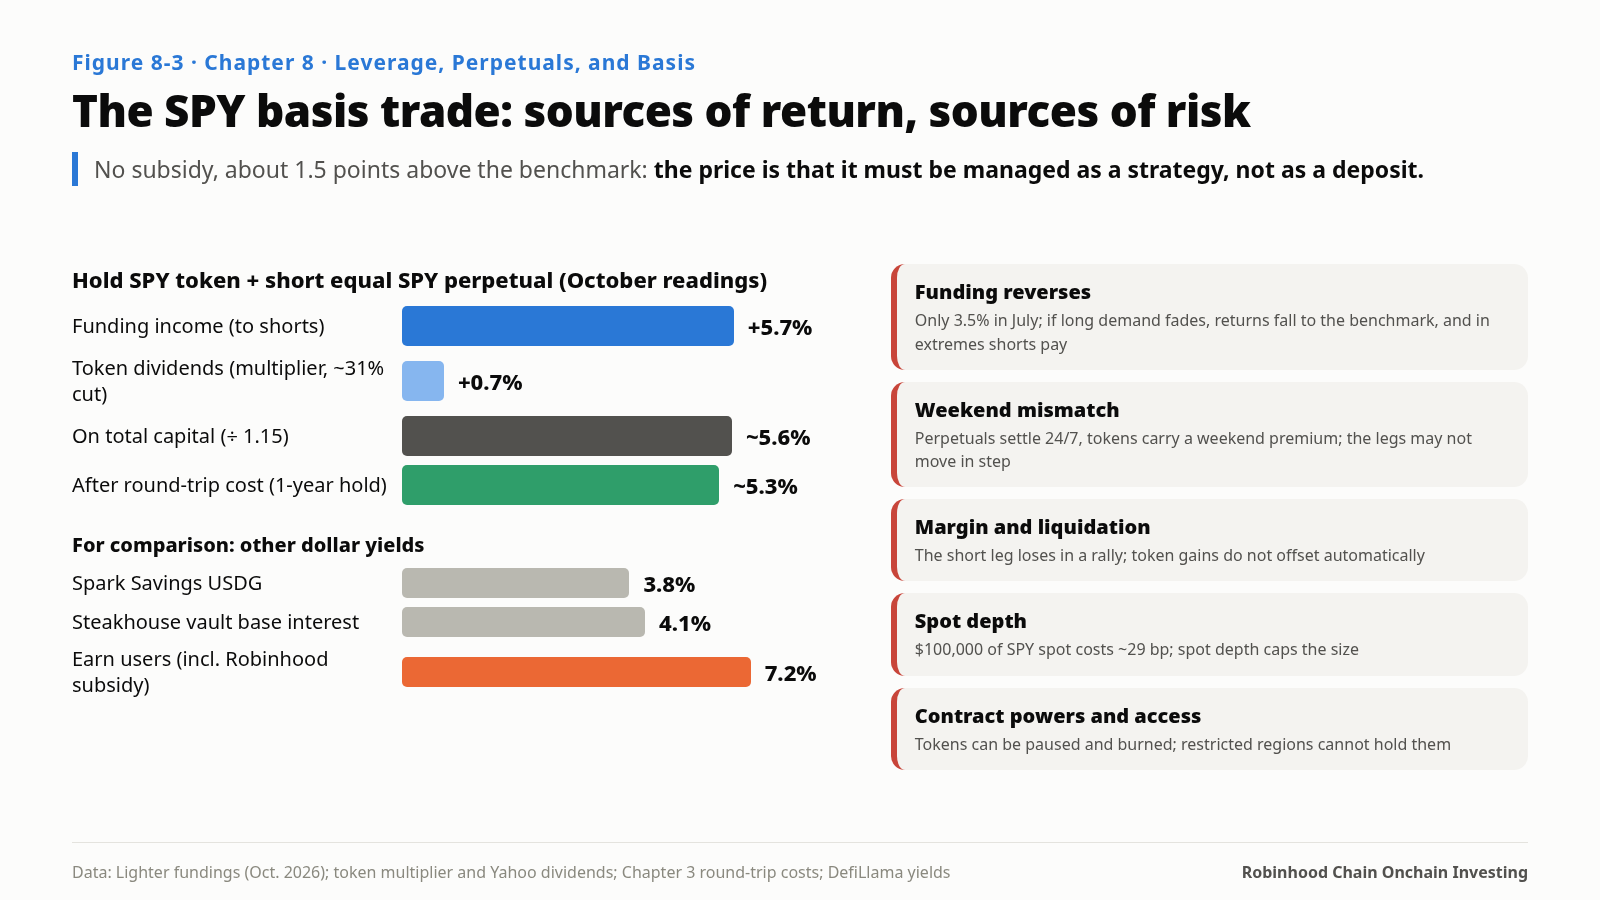
That is 1–1.5 points above Spark Savings’ 3.8% and the vault’s roughly 4.1% base rate, below Earn users’ 7.2%, and it contains no subsidy at all: it comes entirely from longs’ demand for leverage. It is one of the few “unsubsidized, above-benchmark” strategies I found on this chain.
The price is that it is far more complex than a deposit:
- Funding can flip. SPY was only 3.5% in July; if long demand fades, the return falls back to the benchmark, and in extremes shorts pay.
- The legs drift apart on weekends. Perpetuals settle 24/7 while stock tokens carry a weekend premium, so opening or closing on weekends can misalign the two prices.
- Margin and liquidation. When the stock jumps, the short leg loses and needs margin, while the token leg’s gain sits elsewhere onchain and does not offset automatically. Too little margin and one big up day breaks the hedge.
- Spot depth caps the size. $100,000 of SPY spot token costs about 29 basis points to buy; $1 million barely fills.
- Contract powers and access. Stock tokens can be paused and burned by an administrator, and where the terms forbid holding them, the spot leg is not available at all.
Two unusual markets are worth knowing: ANTHROPIC and OPENAI perpetuals, on companies that are not yet public, each trading about $30 million a day at up to 5x leverage. ANTHROPIC’s funding ranged from +0.21% to −0.34% in a single hour; it was negative for all of July and rose to 15.6% annualized in August. It gives ordinary investors a new tool: a way to express a view on the valuation of a leading private company outside primary markets. With no public, continuous price as an anchor, treat it as a view, not an investment in the company.
The Other End: How Much for High-Volatility Tokens
Leverage magnifies an exposure you understand. A new token is a lottery ticket you mostly don’t. What it needs is not stock-picking skill but position math.
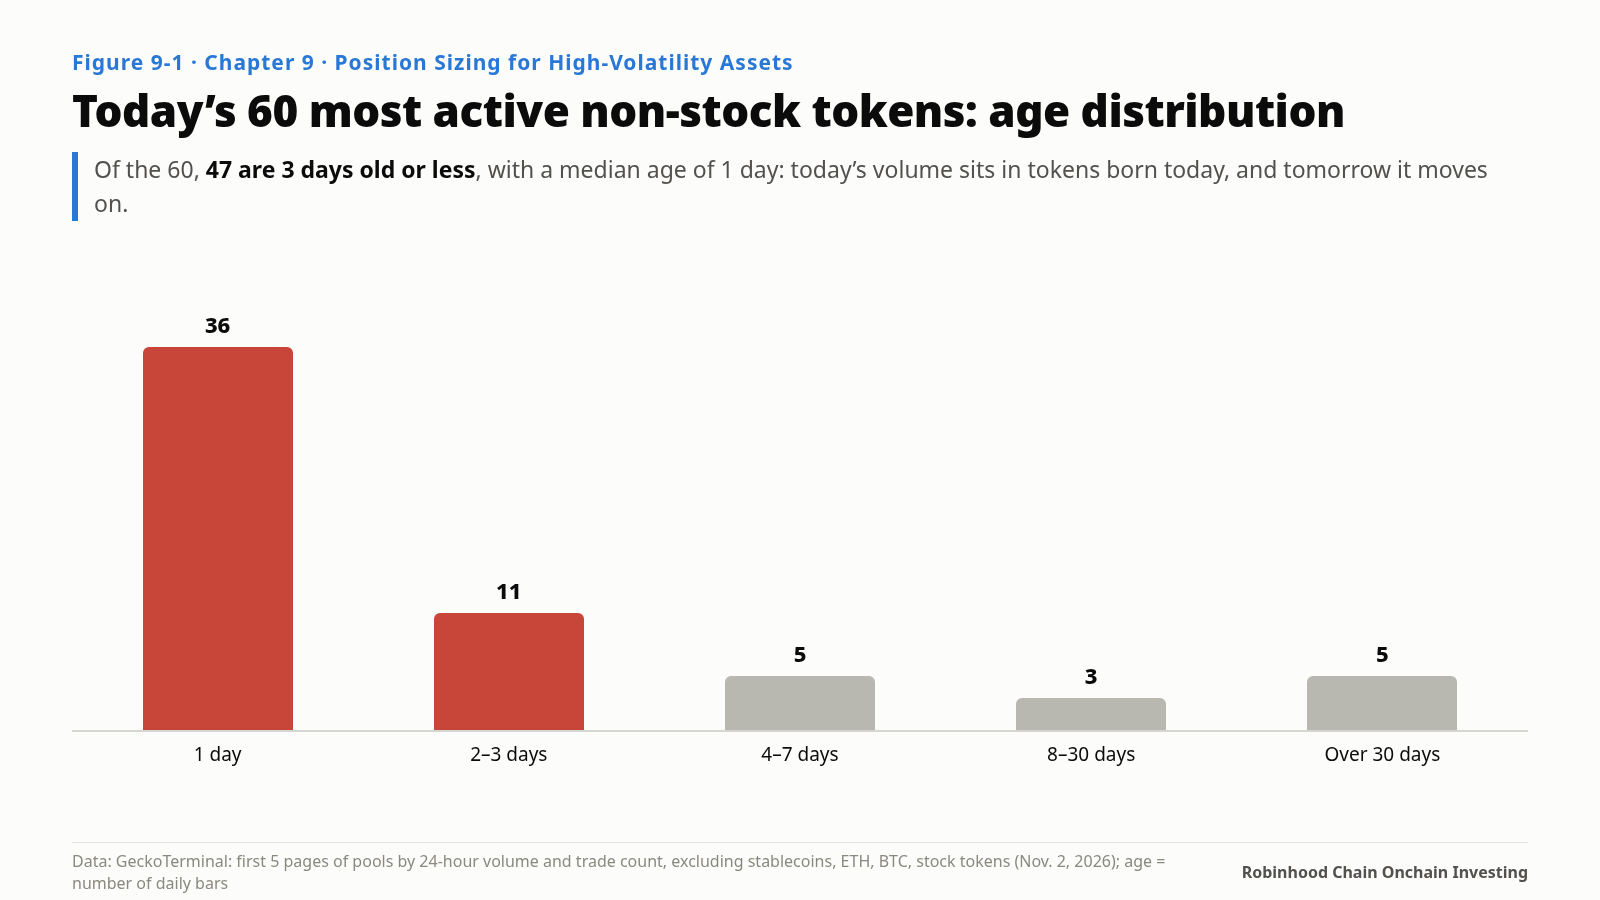
On November 2, I took the first five pages of the chain’s most active pools, removed stablecoins, ETH, bitcoin and stock tokens, and got 60 tokens. Forty-seven of them were no more than three days old; the median age was one day. Today’s volume concentrates in tokens born today; tomorrow it moves to tokens born tomorrow.
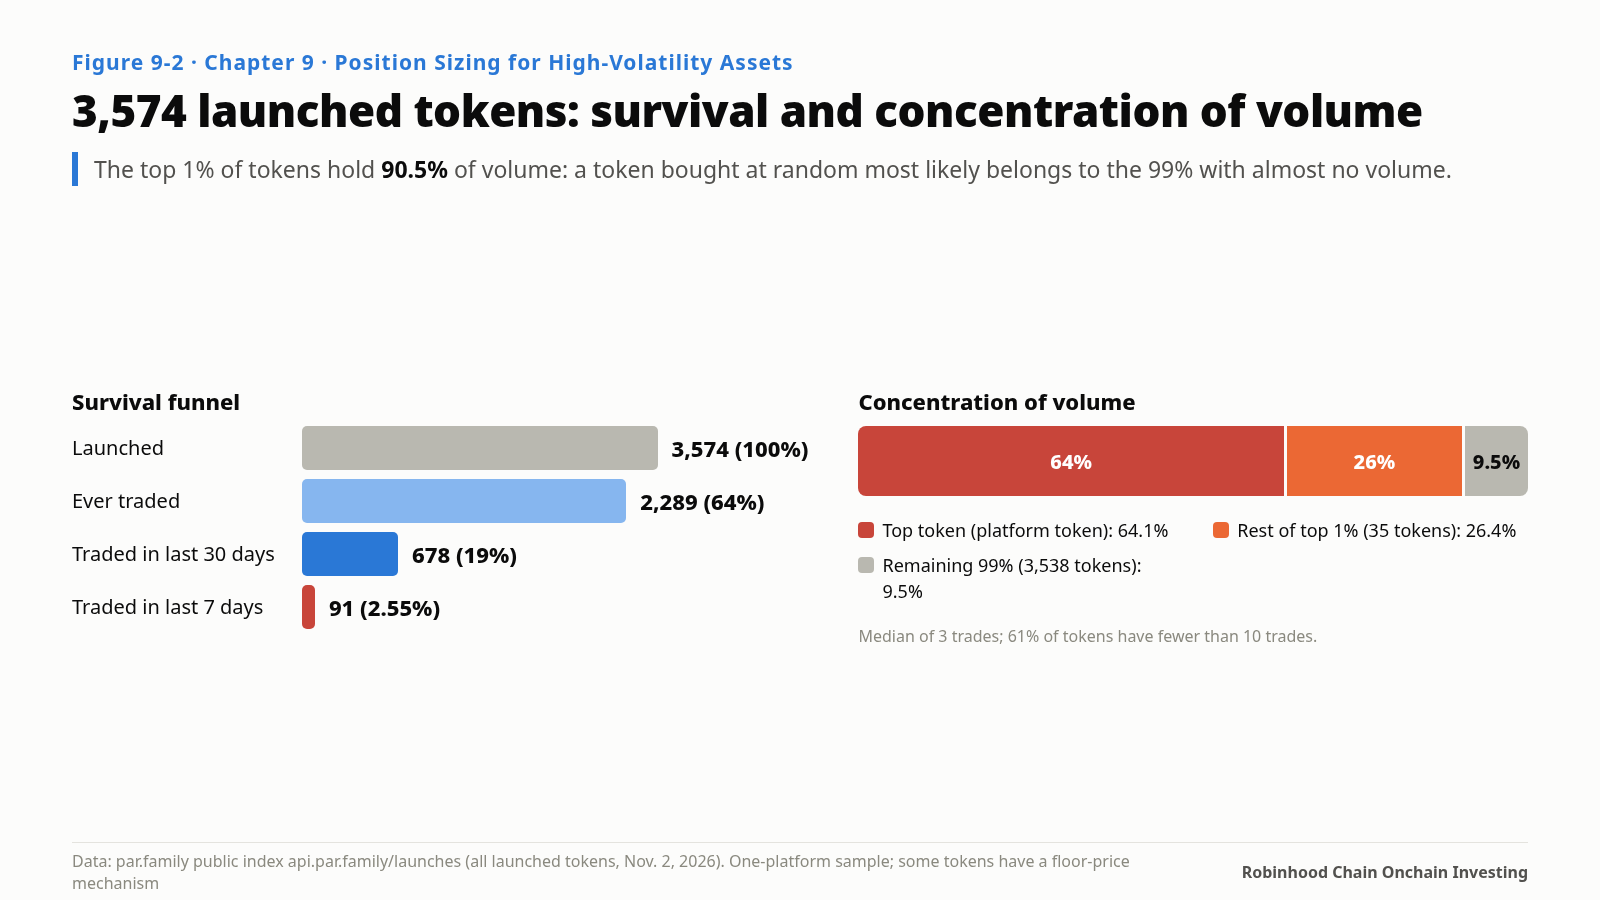
par is one of the few launchpads that publishes a complete launch index, including tokens no one trades anymore, which makes it the cleanest sample for measuring this sector. As of November 2 it had launched 3,574 tokens: 64% traded at least once, 19% traded in the last 30 days, and 2.55% traded in the last 7 days. The top 1% of tokens by volume accounted for 90.5% of all volume. Launchpads differ in mechanics, but the shape of survival and concentration is quite consistent.
Even among the eight winners that survived more than a week and are still on today’s active list: from day one to the all-time high, the median gain was 3.0x; from the high to November 2, the median drawdown was 49%; the median time from day one to the peak was just 8.5 days. Even if you pick a winner, it spends most of the time you hold it falling from its high.
What the Kelly Criterion Says
Using a transparent, assumed distribution:
- Random picks: 90% fall 90%, 8% go flat, 2% go to 10x. Expected multiple 0.37, below 1. Kelly says 0.
- Some selection skill: winners rise to 10%. Expected multiple 1.27. Kelly says about 4%.
- Strong selection skill: 20% go to 10x. Expected multiple 2.35. Kelly says about 24%.
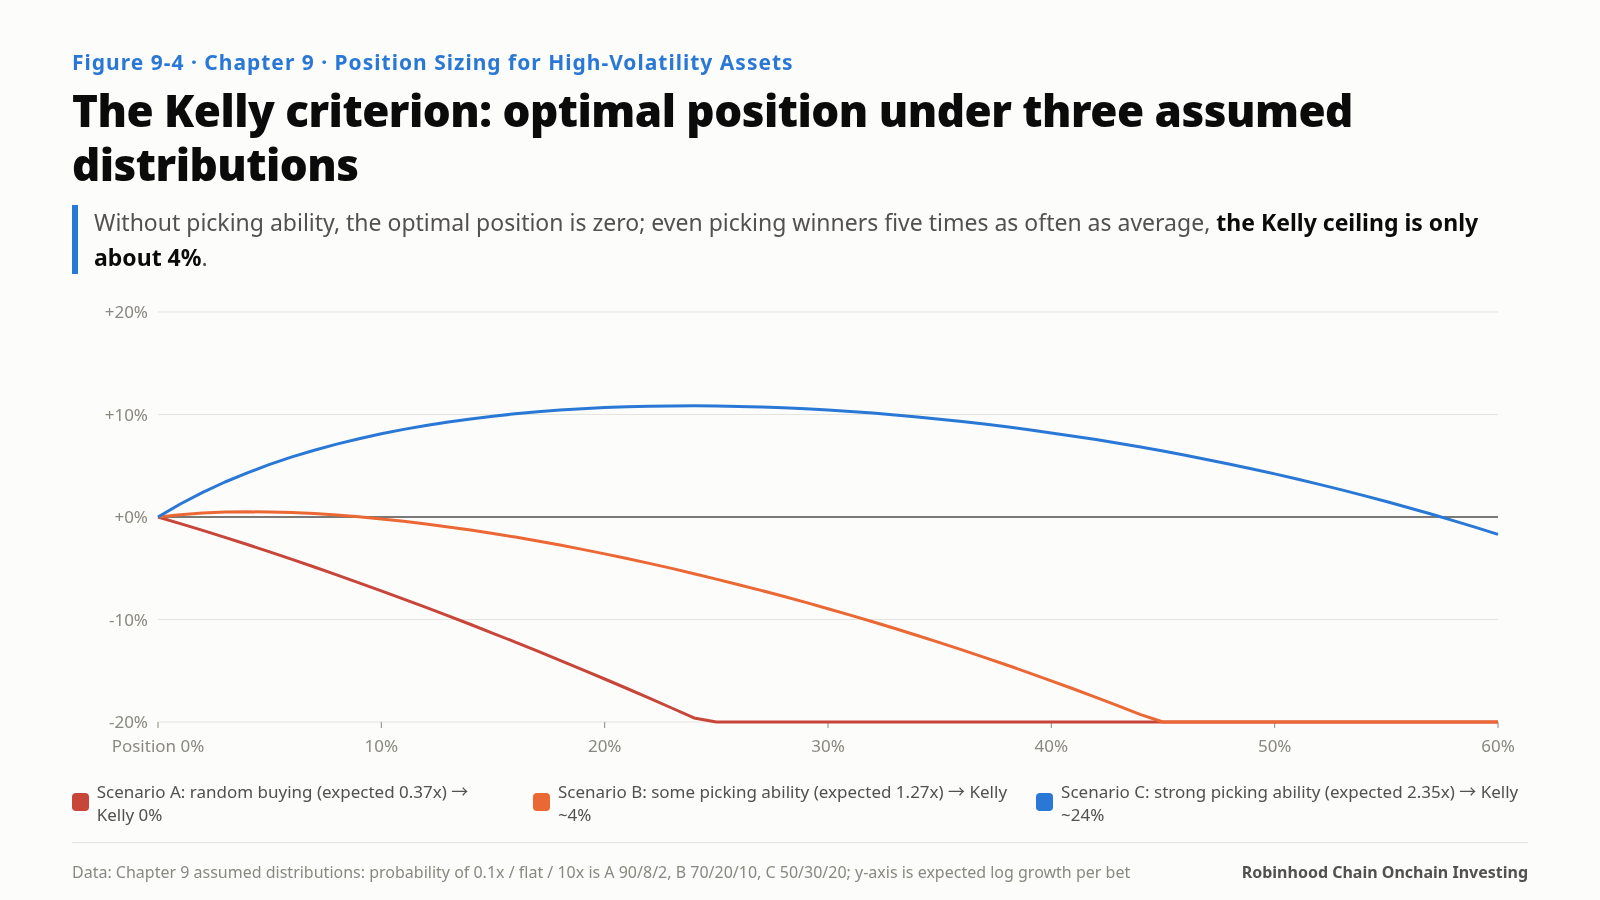
Without selection skill, the optimal size is zero, and no amount of diversification fixes a negative expectation. Even if you pick winners at five times the average rate, Kelly allows only about 4%. And Kelly is a ceiling: people almost always overestimate their own selection skill.
Three rules follow:
- Total cap: high-volatility tokens at no more than 5% of onchain assets, 10% at most if you can prove selection skill, sized as if it all goes to zero.
- Per-token cap: no single token above 20% of the lottery bucket, or 1% of total assets.
- Exit on time, not price: survivors take a median 8.5 days to peak, so set a holding period, say two weeks, and cut most of the position when it ends, up or down.
If You Use Leverage or Buy Lottery Tickets Here
- For leveraged longs, use perpetuals, not lending markets: a third to a tenth of the cost, with an order of magnitude more depth.
- Remember the funding bill: longs in stock perpetuals paid 5–12% annualized in October, which can eat more than half a year’s stock gain.
- If you collect leverage’s price, run the basis trade as a strategy, not a deposit: keep ample margin, avoid weekend entries and exits, and cap size at what spot can absorb.
- Before buying a new token, write down your total cap, per-token cap and holding period: rules written before you buy beat rules written after you lose.
Onchain stock traders are almost all long and keep paying for leverage; collecting on the other side is one of the few unsubsidized yields on this chain. In a power-law distribution, the sector’s success and yours are different things; position discipline keeps the other 99% from dragging you down while you wait for the 1%.
Would you rather pay funding as a long, or collect it on the other side?
—Adapted from Where the Yield Comes From: An Investor’s Handbook for Robinhood Chain, Chapter 8, “Leverage, Perpetuals, and Basis,” and Chapter 9, “Position Sizing for High-Volatility Assets”
The full book (15 chapters, 42 figures): https://pickful.ai/books/dgpy
转发此帖子?
与您的关注者分享。
回复