
目录(6 节)

·
Forecasts Expire, Checklists Don't: Three Onchain Portfolios Replayed, Plus a Weekly Watchlist
This piece assembles Robinhood Chain's yield sources into income, enhanced and aggressive portfolios, replays them on real data from August 1 to November 2, and explains what each bets on: subsidies, long demand or U.S. stocks. It ends with a ten-minute weekly watchlist: what to watch, where to look, the threshold and what to do. An analytical framework, not investment advice.
If you now understand where the yield on Robinhood Chain comes from and are ready to allocate, or you already hold positions and want to know what to watch, this piece does two things: it assembles the earlier findings into three portfolio tiers and replays them on real data since August, then compresses everything into a ten-minute weekly checklist.
A note first: this is an analytical framework, not investment advice. The weights illustrate structure; they are not something to copy.
Answer Three Questions First
Before picking a tier, answer three questions. They decide what you can use more than any yield does:
- Where are you? U.S. users get Earn’s subsidy but under the terms may not hold stock tokens; international users are the reverse. That rules out half the options.
- How much money? $10,000 fills anywhere; $1 million runs into the bridge’s per-deposit cap, spot-token depth and LP capacity.
- How large a drawdown can you take? Income portfolios draw down only in tail events and are nearly flat otherwise; portfolios with stock tokens draw down as much as U.S. stocks do.
Three Tiers
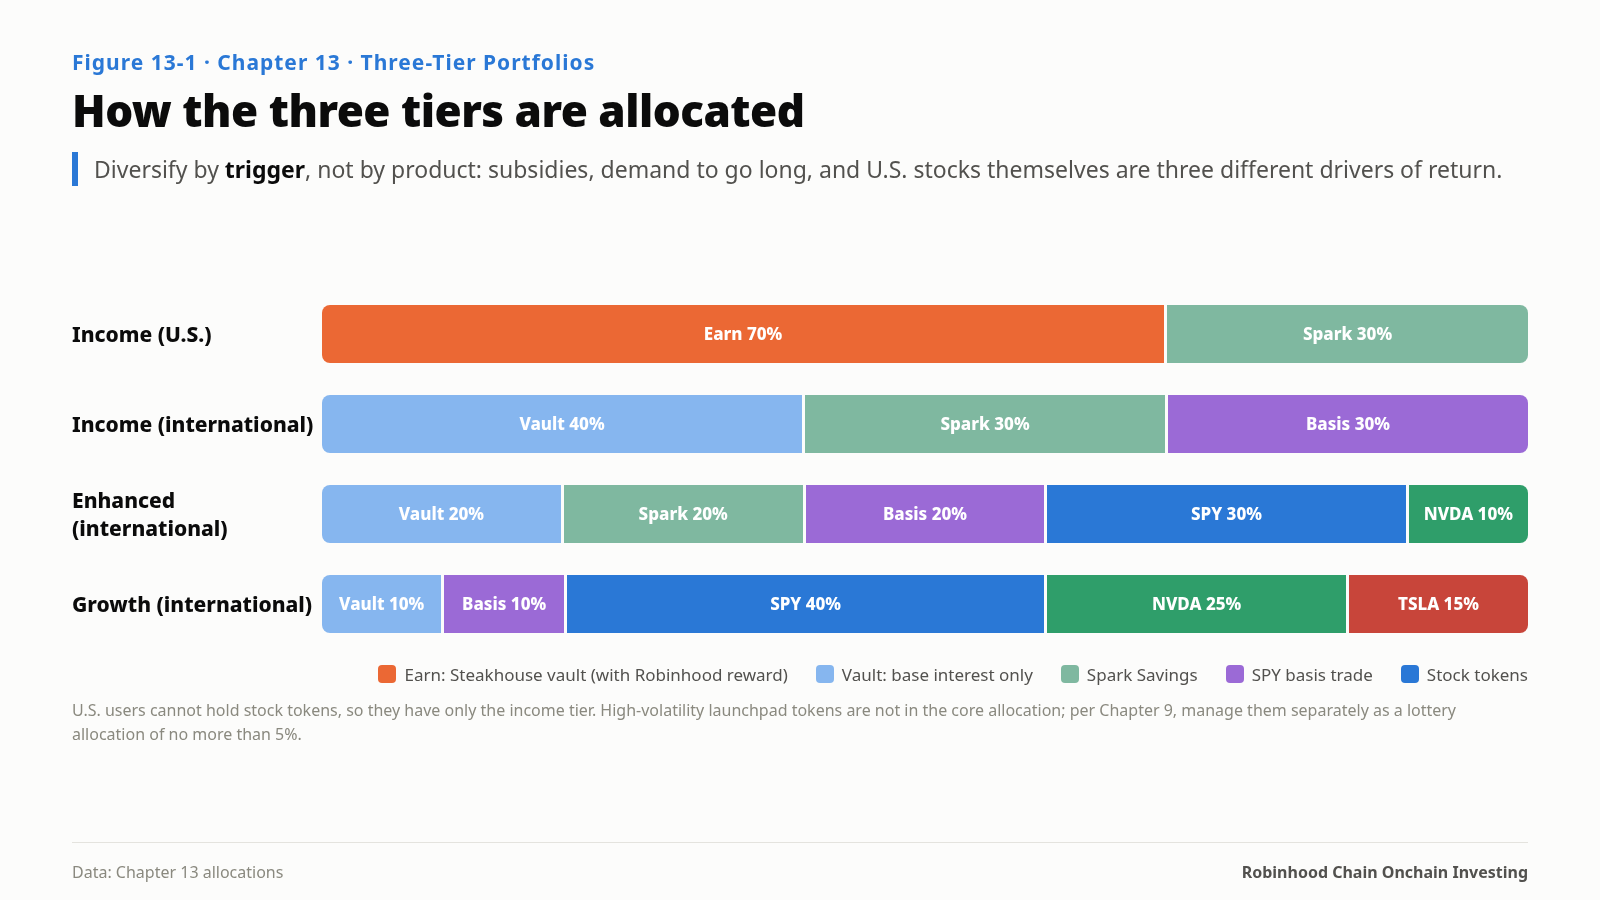
Income: interest only, diversified by trigger. U.S. version: 70% in the Steakhouse USDG vault through Earn, 30% in Spark Savings USDG. International version: 40% deposited directly into the vault (base interest only), 30% Spark, 30% SPY basis trade (hold SPY tokens, short an equal SPY perpetual).
Why put part in Spark? The vault’s main tail risk comes from USDe; Spark’s yield comes from different assets and a different issuer. Diversifying by trigger beats diversifying by product. International users can’t get Earn’s subsidy, so the basis trade replaces part of it, with returns from perpetual longs’ demand for leverage, another distinct trigger.
Enhanced: interest as the base, plus some stock exposure. International version: 20% vault, 20% Spark, 20% SPY basis, 30% SPY tokens, 10% NVDA tokens. Long-term holders of U.S. stocks can put part of the SPY tokens into a stock-against-stock pool like QQQ/SPY and collect fees and UNI rewards while holding.
Aggressive: mostly stock exposure. International version: 10% vault, 10% SPY basis, 40% SPY tokens, 25% NVDA tokens, 15% TSLA tokens. Launchpad tokens stay out of the core; if you want them, run them as a separate lottery bucket of at most 5% of total assets.
U.S. users have no enhanced or aggressive tier: under the terms, they may not hold stock tokens.
Replay: August 1 to November 2
Using real daily data for each component, rebalanced at the start of each month:
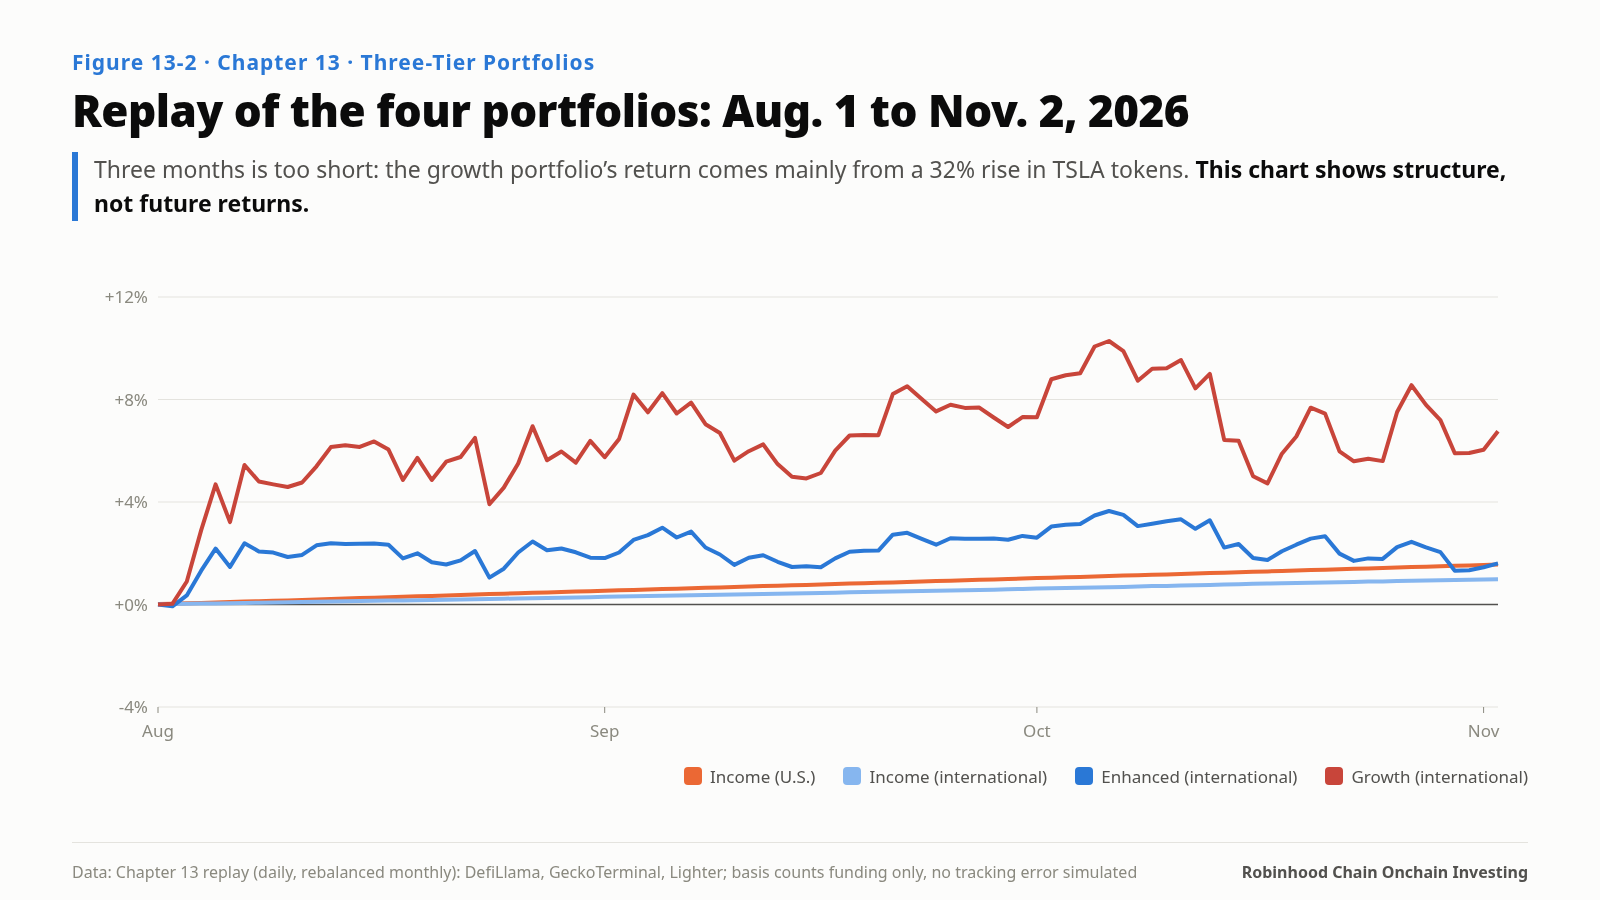
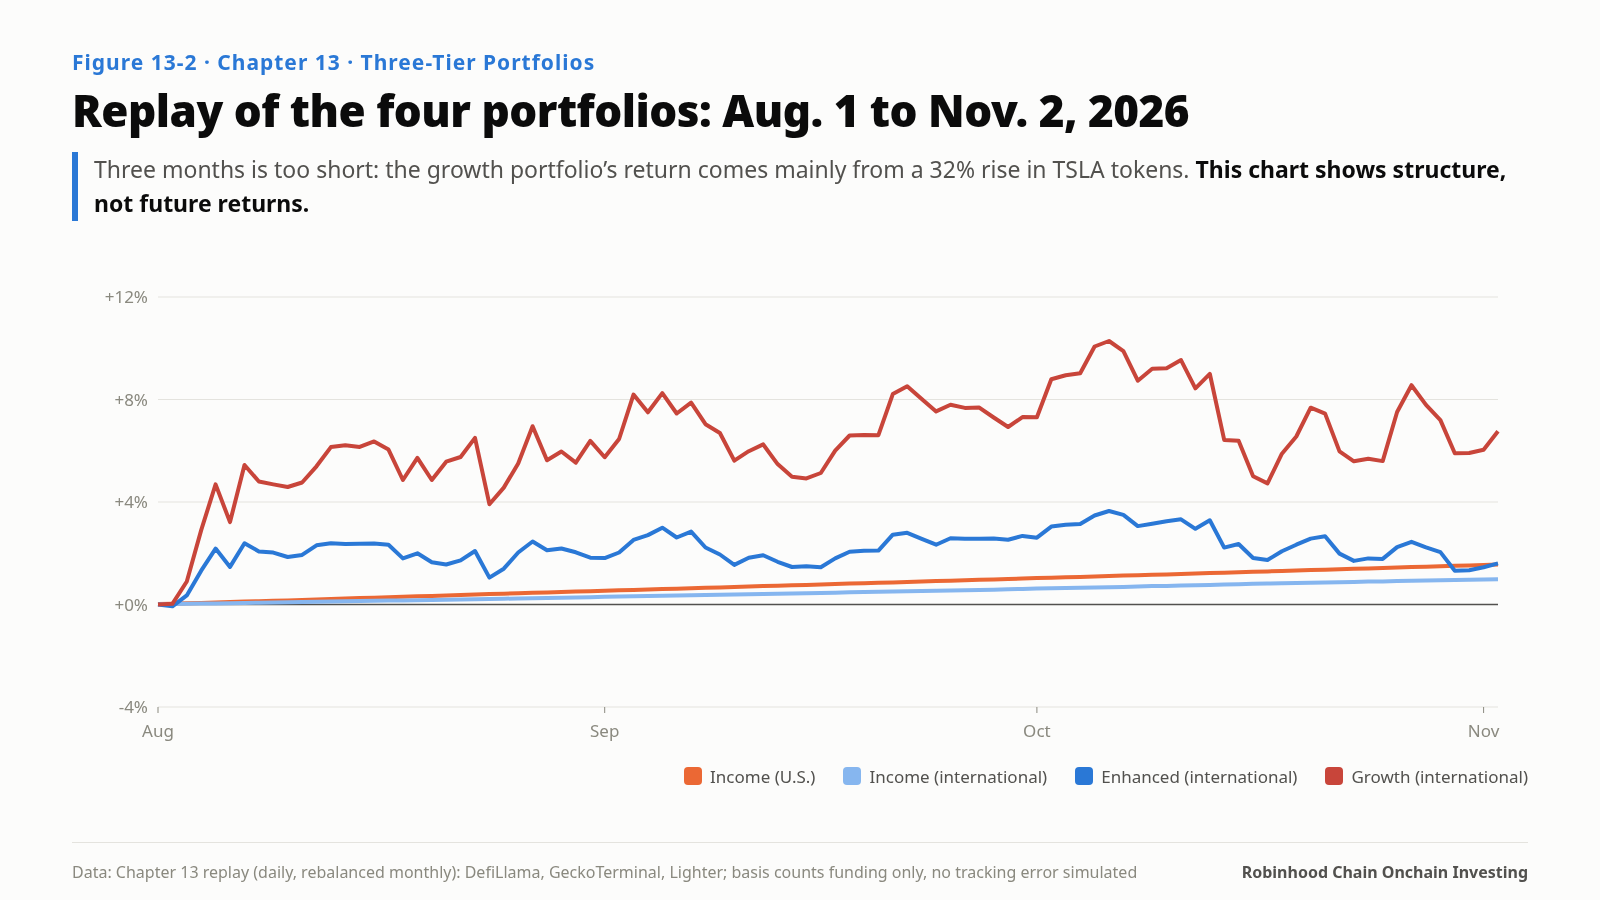
- Income (U.S.): 1.56% for the period, 6.27% annualized, almost no volatility or drawdown.
- Income (international): 0.99%, 3.94% annualized.
- Enhanced (international): 1.60%, 6.44% annualized, 6.8% annualized volatility, −2.25% max drawdown.
- Aggressive (international): 6.76%, 29.27% annualized, 16.1% volatility, −5.04% max drawdown.
Four things to remember when reading this. First, three months is too short. The aggressive tier’s 29% comes mostly from TSLA tokens rising 32% in these three months; another three months could easily be negative. The table shows structure, not future returns. Second, zero drawdown in the income tier is not zero risk; its risk is in the tail. In a 10% USDe depeg, vault depositors could lose 1–5%; it just did not happen in these three months. Third, the basis-trade replay counts funding only and does not simulate tracking error, margin adjustments or weekend misalignment; real volatility would be higher. Fourth, the U.S. income tier is highest because of subsidy: about 3 of its 6.27 points come from Robinhood’s reward.
What Each Portfolio Is Betting On
Three scenarios, not to predict which happens but to show what each tier depends on:
- Onchain activity expands: borrowing demand lifts the vault’s base rate; long demand lifts funding; stock-token liquidity improves. All three tiers benefit.
- Status quo: income tier about 6–7% for U.S. users and about 4% for international users; basis trade about 4–6%; stock tokens earn what U.S. stocks earn, minus about 0.3 points of dividend haircut and trading costs.
- Subsidies taper or rules tighten: if Ethena leaves, the vault’s base rate may fall below 1%; if both sponsors leave, the income tier approaches Spark’s 3.5–4%; the basis trade barely depends on subsidies; a paused stock token freezes along with any pool containing it.
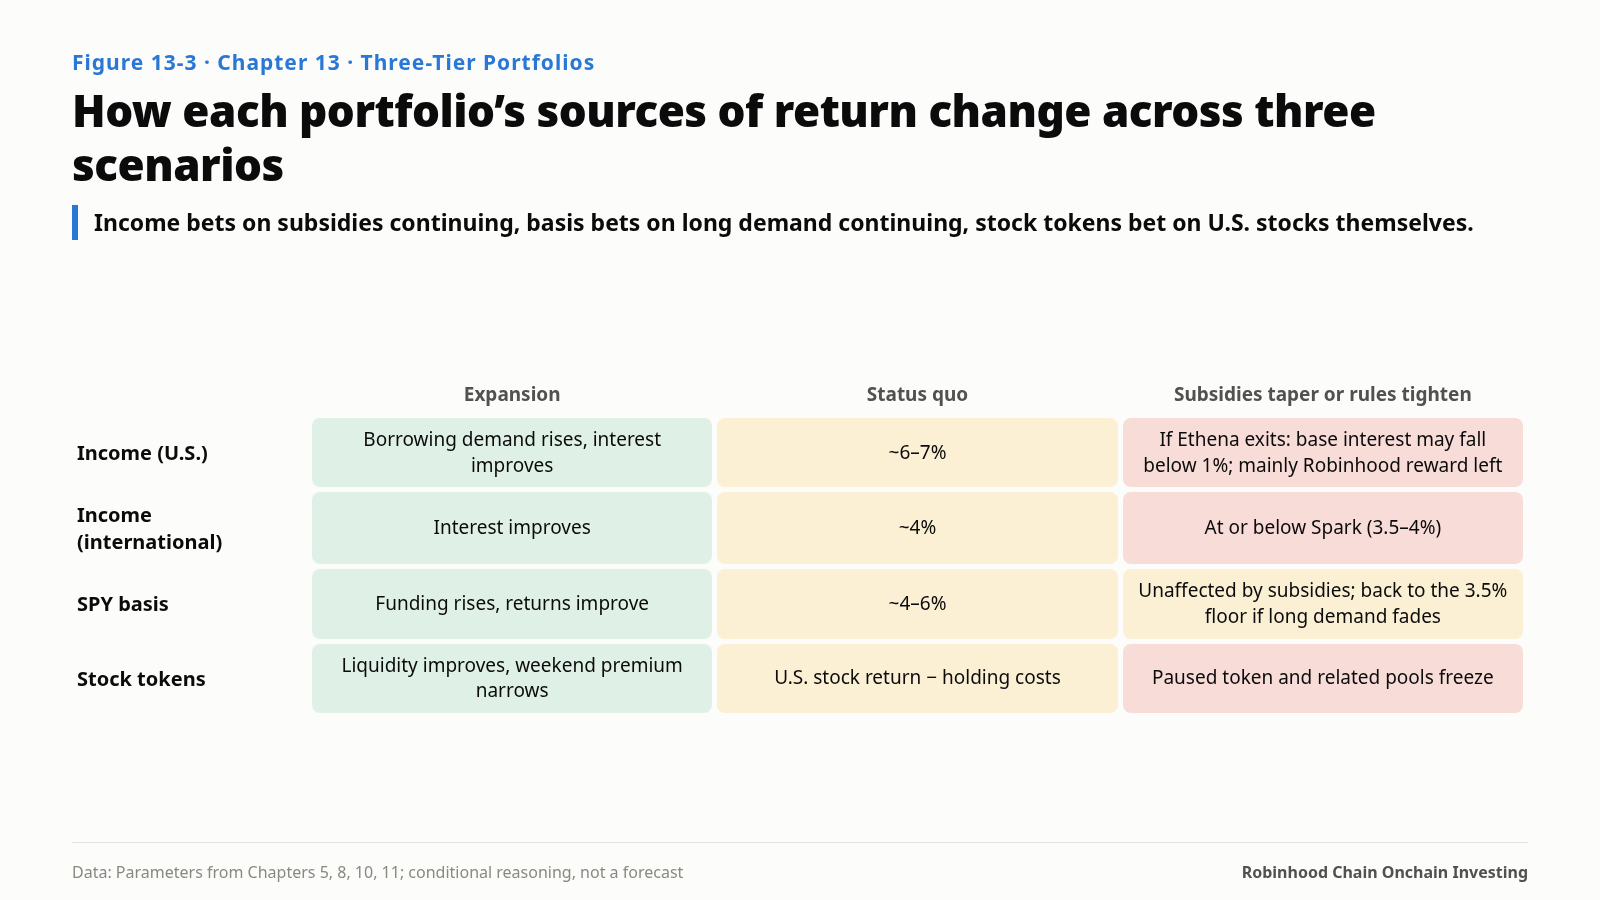
The income tier bets on subsidies continuing, the basis trade on long demand continuing, and stock tokens on U.S. stocks themselves. Different drivers are exactly why they belong together.
Size matters too: under $10,000, use the income tier only and hold for at least a month; from $100,000 to $500,000, get stock exposure through perpetuals or the order book and build in tranches; above $500,000, split deposits and keep any single vault or pool under 5% of its size. Above 5%, you are no longer a price taker; you are part of the price.
Why a Checklist, Not a Forecast
This chain has run for four months. First-phase data can show structure, not outcomes. Structure changes: subsidies get adjusted, borrowers change, new assets arrive, regulatory doors open and close. What I can do is list the signals that would change the structure, check them regularly, and adjust when they appear.
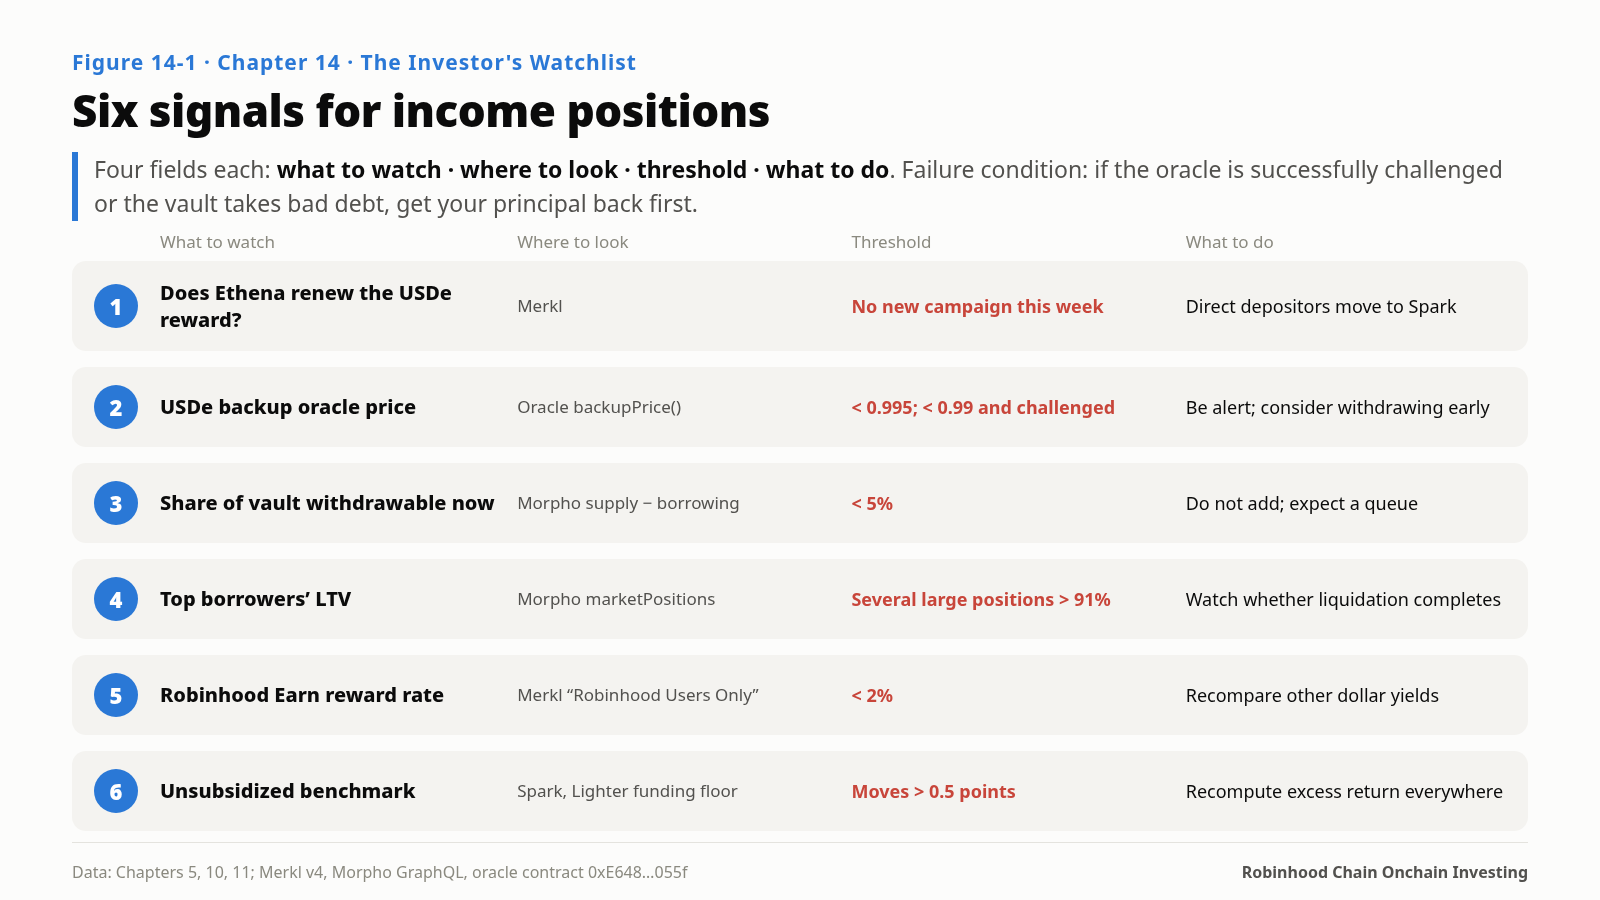
Each checklist item has four fields: what to watch, where to look, the threshold, what to do when it is reached. The most important ones by position type:
Income positions
- Whether Ethena renews the USDe collateral reward: Merkl’s campaign list for that market. No new campaign this week means expect the vault’s base rate to drop within one to two weeks; direct depositors should consider Spark.
- USDe’s market price: the oracle contract’s backup price. Below 0.995, be on alert; below 0.99 with a challenge open, consider withdrawing early.
- The share of the vault withdrawable immediately: supply minus borrowing in the looping markets on Morpho. Below 5% means withdrawals may queue; stop adding.
- The Earn reward rate: below 2%, U.S. users’ advantage is shrinking; recompare.
Stock-token positions
- Changes to the token multiplier: recalibrate price-gap calculations around dividend dates.
- Trading-hours price gap after multiplier correction: a persistent deviation above 50 basis points may mean the arbitrage channel is blocked; stop adding.
- Pause and admin events on the contract: any pause, burn or upgrade means reassessing every linked position, including LP and collateral.
Leveraged and basis positions
- SPY perpetual 30-day annualized funding: below 3.5% the basis trade’s excess return is gone; if it stays there two weeks, consider closing.
- Funding direction: negative for 24 consecutive hours means the long-short balance has flipped and the basis trade starts paying.
Ten Minutes a Week
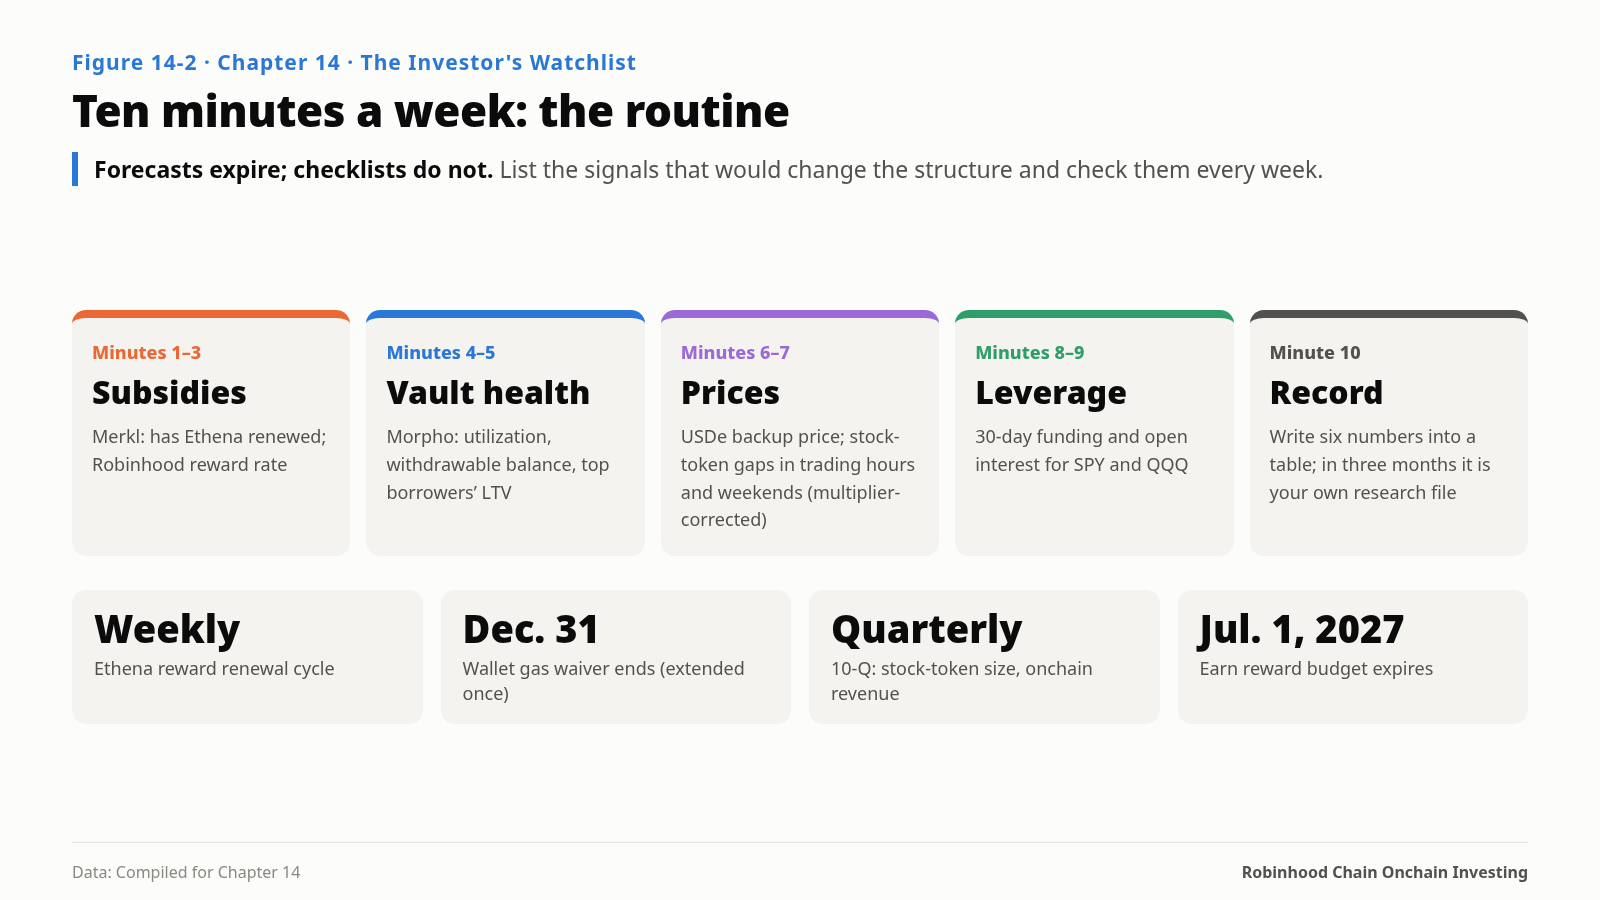
- Minutes 1–3, subsidies: has Ethena renewed the USDe campaign; what is the Robinhood campaign’s current rate?
- Minutes 4–5, vault health: utilization in the looping markets, the withdrawable balance, top borrowers’ LTVs.
- Minutes 6–7, prices: the USDe backup price; for stock-token holders, trading-hours and weekend gaps.
- Minutes 8–9, leverage: 30-day funding and open interest for SPY and QQQ.
- Minute 10, record: write the six numbers into a table. In three months you will have notes that understand this chain better than any report.
Some questions first-phase data can’t answer. When every subsidy tapers, how many dollars will stay? Will stock tokens open to U.S. users? Will perpetuals on pre-IPO companies become a lasting market or a passing craze? Of Robinhood’s roughly 28.6 million funded customers, how many will make this chain a place for everyday investing? The answers will arrive over the next few quarters, and the signals on this checklist are where they will show up first.
A good portfolio is not the one with the highest return. It is the one where you know who pays each part, what each part is betting on, and when to leave. Forecasts expire; checklists don’t.
Which numbers would you check in your ten minutes each week?
—Adapted from Where the Yield Comes From: An Investor’s Handbook for Robinhood Chain, Chapter 13, “Three-Tier Portfolios,” and Chapter 14, “The Investor’s Watchlist”
The full book (15 chapters, 42 figures): https://pickful.ai/books/dgpy
转发此帖子?
与您的关注者分享。
回复